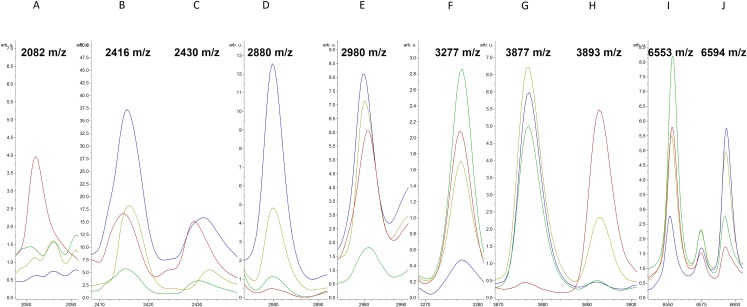
Figure 2. Average spectra of characteristic peaks among various MLST types.
Intensities of characteristic peaks (m/z 2,082, 2,416, 2,430, 2,880, 2,980, 3,277, 3,877, 3,893, 6,553, and 6,594, from A to J, respectively) in ST5 (red), ST59 (green), ST239 (blue), and other ST types (yellow) expressed in arbitrary intensity units.

