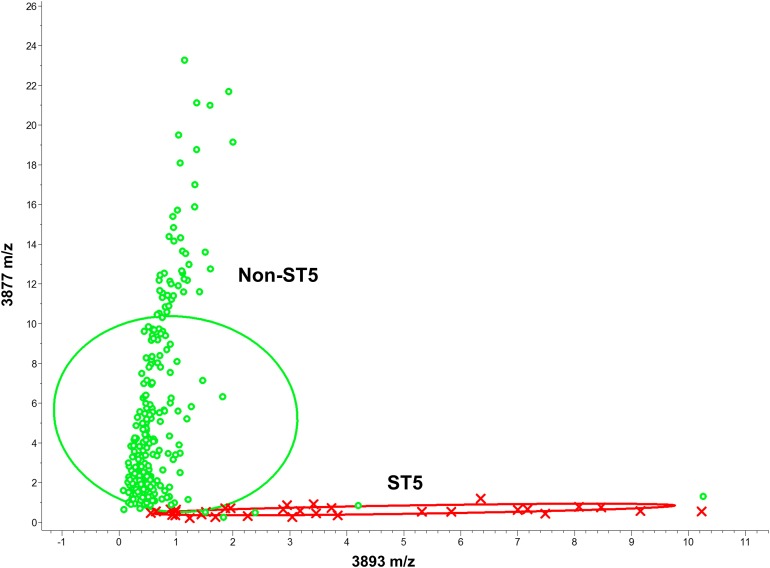
Figure 3. Scatter plot of the ST5 and non-ST5 isolates.
The peaks at m/z 3,893 and m/z 3,877 served as the x- and y-axes, respectively. Intensities of the characteristic peaks were expressed in arbitrary intensity units. The ellipses represent the 95% confidence intervals of peak intensities for ST5 (red ellipse) or non-ST5 (green ellipse). ST5: red crosses, non-ST5: green circles.

