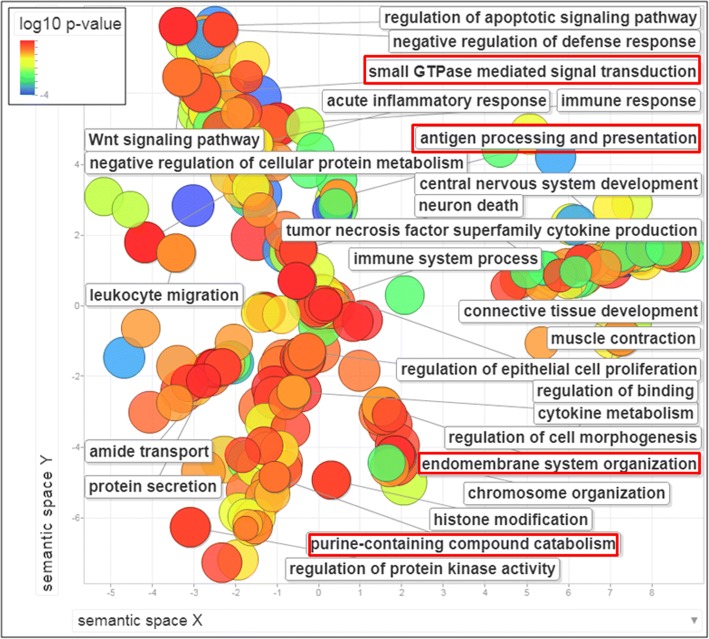
Fig. 2.
Terms of Gene Ontology biological processes enriched in the comparison between SAC and hmMSI-H for their methyloma profile. The scatterplot shows the biological processes which are globally differentially methylated between SAC and hmMSI-H after GO term redundancy reduction. The graph is represented in a two-dimensional space derived by applying multidimensional scaling to a matrix of the GO terms’ semantic similarities [35]. Terms associated with higher methylation in hmMSI-H are shown in red squares. Colour intensity indicates level of significance (log10 p value). Circle diameter indicates number of genes for each biological process

