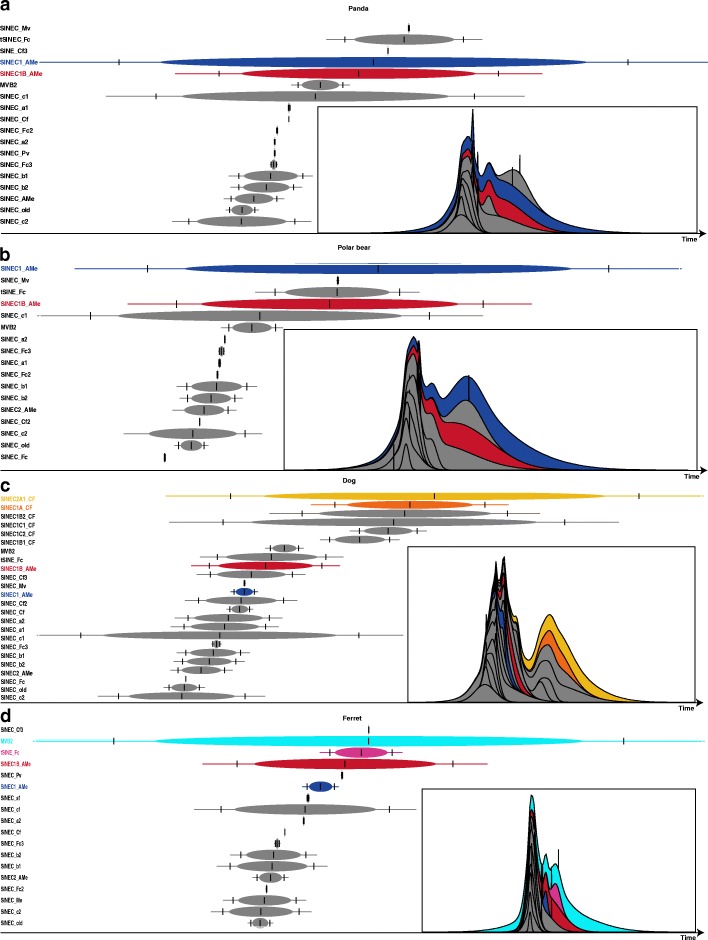
Fig. 3.
Transposition in transposition (TinT) patterns of SINEs in panda (a), polar bear (b), dog (c), and ferret (d) genomes. SINEC1_AMe and SINEC1B_AMe subfamilies are displayed in blue and red in all panels. SINEC2A1_CF andSINEC1C1_CF are displayed in yellow and orange (c), MVB2 and tSINE_Fc are displayed in wathet blue and pink (d), whereas other SINE subfamilies are colored in grey. A central vertical line indicates the period of maximal activity within the colored ovals. The 75th percentile of the activity range is shown as flanking vertical lines; the terminal lines manifest the 99th percentile range of activity. The timescale runs from left to right is for old to young. The corresponding cumulative likelihoods of element family activity are given as thumbnails in the insets

