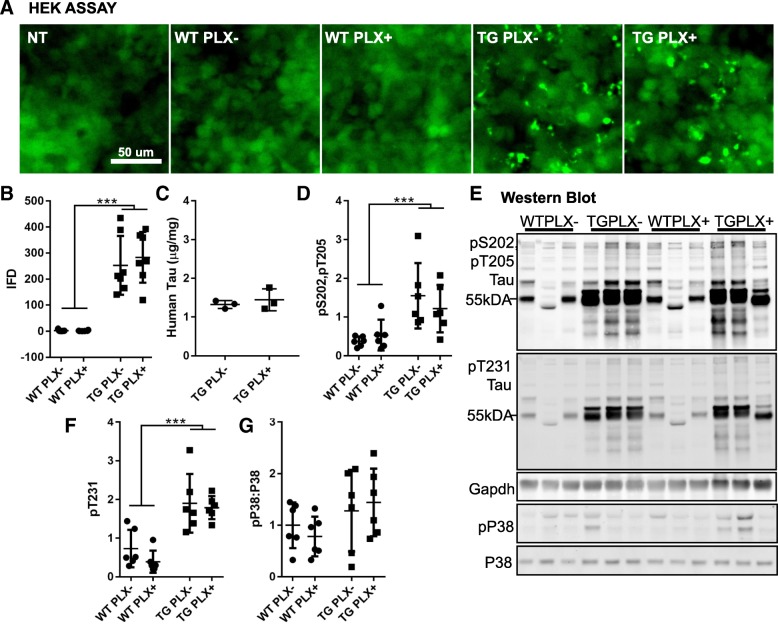
Fig. 2.
Tau characteristics in PLX treated and untreated mice are similar. a Images of HEK cells 16 h after treatment with 0.1 μg wild-type (WT) or Tg4510 (TG) brain homogenate. Non-treated (NT) cells were handled similarly with 1% lipofectamine in OPTIMEM but brain homogenate was omitted. Protein aggregates were easily seen with 488 nm fluorescent excitation in TG treated samples. b Integrated FRET density (mean fluorescence intensity x number of FRET+ cells) was quantified from an average of three wells per sample. c A total human tau ELISA from three randomly selected Tg4510 mice treated with or without PLX (Student’s t test, not significant). d Quantification of pS202, pT205 (AT8) labeling from the Western blot shown in (e) normalized to Gapdh. e Western blot of phosphorylated tau, Gapdh, active pP38, and total P38 in wild-type and Tg4510 mice. f Quantification of pT231 from panel (e) normalized to Gapdh. g Quantification of active pP38 ratio to total P38 from westerns shown in (e). Unless otherwise indicated, all data were analyzed by two-way ANOVA followed by Sidak’s multiple comparisons. Error bars represent means ±Std. Dev. ***p < 0.001

