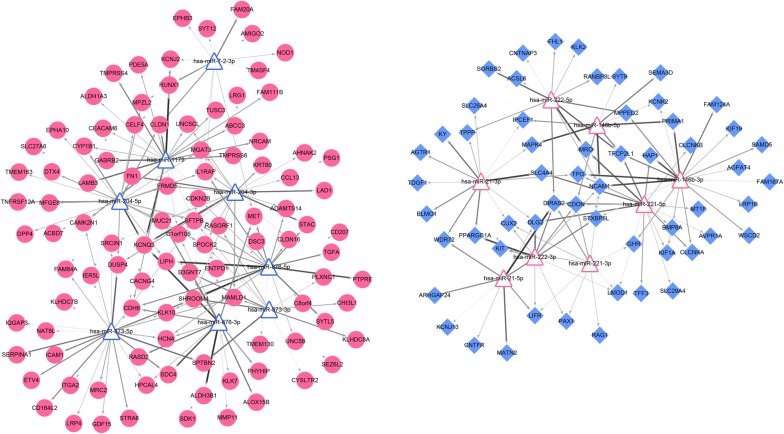
Fig. 4.
miRNA-mRNA negative regulatory networks of differentially expressed genes (DEGs) and miRNAs (DEMs). Each red circle represents an up-regulated DEG and each blue rhombus represents a down-regulated DEG; red triangles represent up-regulated DEMs and blue triangles represent down-regulated DEMs. Line thicknesses represents the Pearson correlation coefficient

