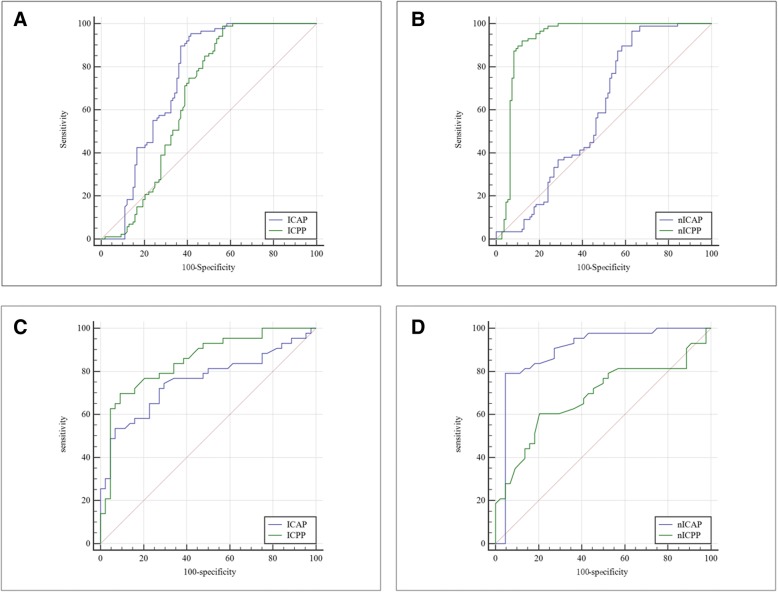
Fig. 4.
ROC curves for ICAP, ICPP, nICAP and nICPP. The ROC curves of (a) ICAP, ICPP, (b) nICAP and nICPP between gastric cancer and benign gastric wall lesions groups. nICPP has the highest AUC value, followed by ICAP, ICPP and nICAP. The ROC curves of (c) ICAP, ICPP, (d) nICAP and nICPP between poorly and well-differentiated gastric adenocarcinoma groups. nICAP has the highest AUC value, followed by ICPP, ICAP and nICPP

