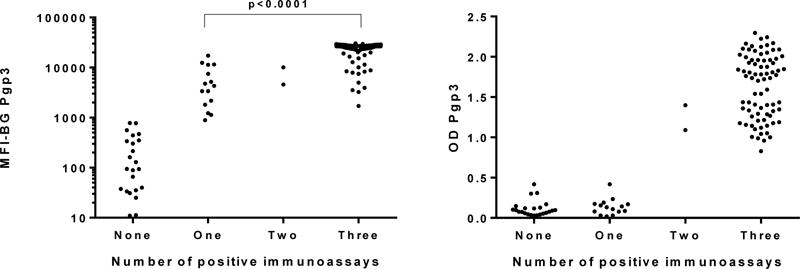
Figure 1.

Intensity of antibody responses to Pgp3 antigen stratified by the number of positive immunoassays. Y-axis shows median fluorescence intensity with background subtracted out (MFI-BG) for the multiplex bead array (left panel) or the absorbance at 405 nm (OD Pgp3) for the ELISA (right panel). X-axis shows data stratified by the number of assays in which a sample tested positive. Each dot represents an individual specimen. A p-value of <0.05 was considered statistically significant.
