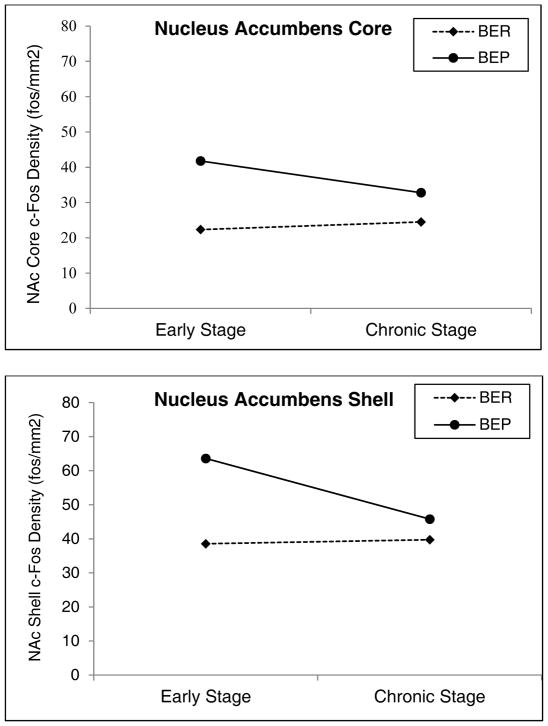
Figure 1. Differences in Fos Density Between BE Prone and BE Resistant Rats across Stage of BE in the Nucleus Accumbens Core and Shell.
Note. BER = binge eating resistant, BEP = binge eating prone, NAc = nucleus accumbens. Mean comparisons of Fos density (Fos cells/mm2) in the a controlling for 1-hour PF consumption prior to sacrifice. Early Stage = feeding tests 1–6, Chronic Stage = feeding tests 7–24. Error bars represent one standard error. Sample sizes for nucleus accumbens core: early stage BER n = 9, early stage BEP n = 5, chronic stage BER n = 6, chronic stage BEP n = 6. Sample sizes for nucleus accumbens shell: early stage BER n = 10, early stage BEP n = 5, chronic stage BER n = 6, chronic stage BEP n = 6.

