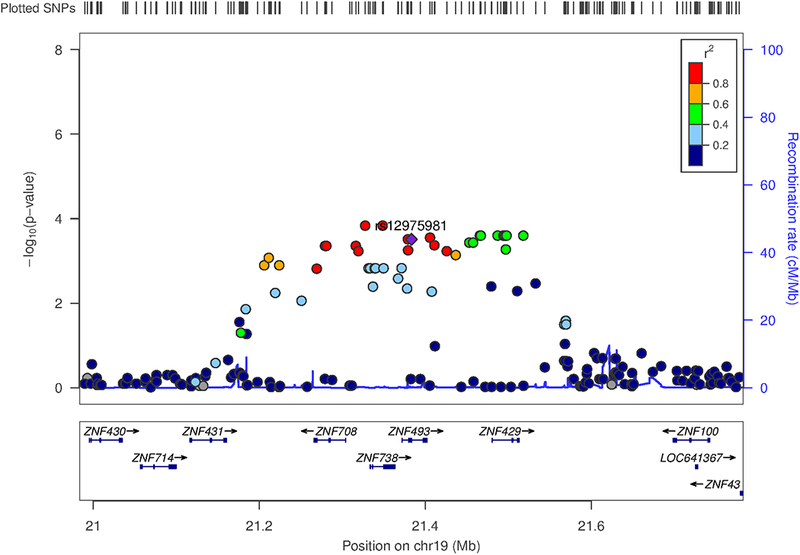
Figure 2. Regional association plot.

Regional association plot of the region on chromosome 19 in which the two genes (ZNF493, ZNF429) associated with lithium response and significantly affected by lithium treatment are located. The index SNP is the top-SNP (rs12975981) of ZNF493 and is shown as a purple diamond. Association p-values of SNPs are plotted as points. SNPs are colored based on linkage disequilibrium with the index SNP. cM, centimorgan; Mb, megabase; SNP, single nucleotide polymorphism.
