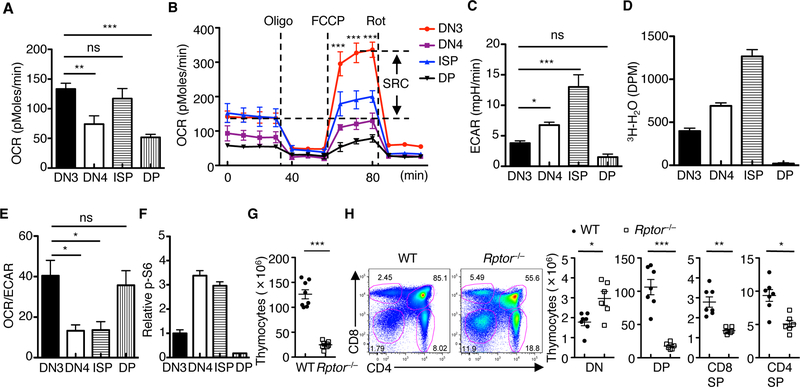
Fig. 1. Dynamic regulation of cell metabolism and mTORC1 activity and the requirement of RAPTOR in thymocyte development.
(A and B) OCR in thymocyte subsets under basal condition (A) or in response to the indicated mitochondrial inhibitors (Oligo, Oligomycin; FCCP, carbonyl cyanide p-trifluoromethoxyphenylhydrazone; and Rot, Rotenone) (B). SRC, spare respiratory capacity (SRC of DN3 cells is shown). (C and D) Measurement of ECAR (C) and glycolytic activity (D) in freshly isolated thymocyte subsets. (E) Ratio of OCR to ECAR in thymocyte subsets. (F) Relative phosphorylation of S6 (mean fluorescence intensity (MFI) in DN3 cells is set to 1) in thymocyte subsets. (G) Total thymocyte cellularity of WT and Rptor–/– mice. Each symbol represents an individual mouse (n = 8 each group). (H) Flow cytometry of thymocyte subsets in WT and Rptor–/– mice (left). Right, cellularity of the indicated thymocyte subsets (DN, CD4–CD8–; DP, CD4+CD8+; CD8SP, CD4–CD8+TCRβ+; and CD4SP, CD4+CD8–TCRβ+). Each symbol represents an individual mouse (WT, n = 7; Rptor–/–, n = 6). Data are mean ± s.e.m. ns, not significant; *P < 0.05, **P < 0.001, and ***P < 0.0001. One-way analysis of variance (ANOVA) with Tukey test (A to E), or two-tailed unpaired t-test (G, H). Data are combination of three independent experiments (A to E), or representative of at least ten independent experiments (F to H). Numbers indicate percentage of cells in gates.

