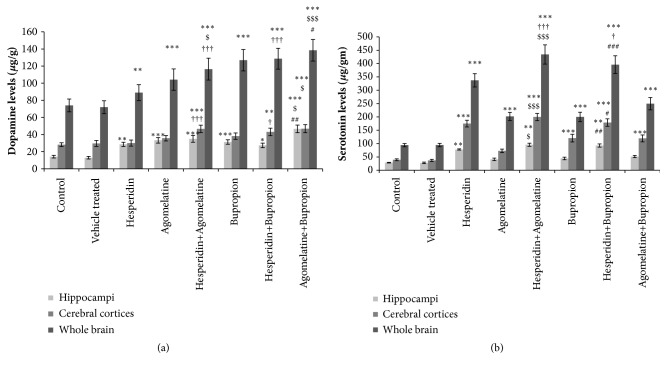
Figure 3.
(a) Estimation of dopamine levels in hippocampi, cerebral cortices, and whole brain by HPLC-FD. Significant difference is denoted by ∗∗∗ P<0.001 as compared to control group; $$$ P<0.001 and $$ P<0.01 as compared to agomelatine treated group; ### P<0.001 as compared to bupropion treated group; ††† P<0.001 and †† P<0.01 as compared to hesperidin treated group. (b) Estimation of serotonin levels in hippocampi, cerebral cortices, and whole brain by HPLC-FD. Significant difference is denoted by ∗∗∗ P<0.001 as compared to control group; $$$ P<0.001, $$ P<0.01, and $ P<0.05 as compared to agomelatine treated group; ### P<0.001 and ## P<0.01 as compared to bupropion treated group; †††P<0.001 as compared to hesperidin treated group.

