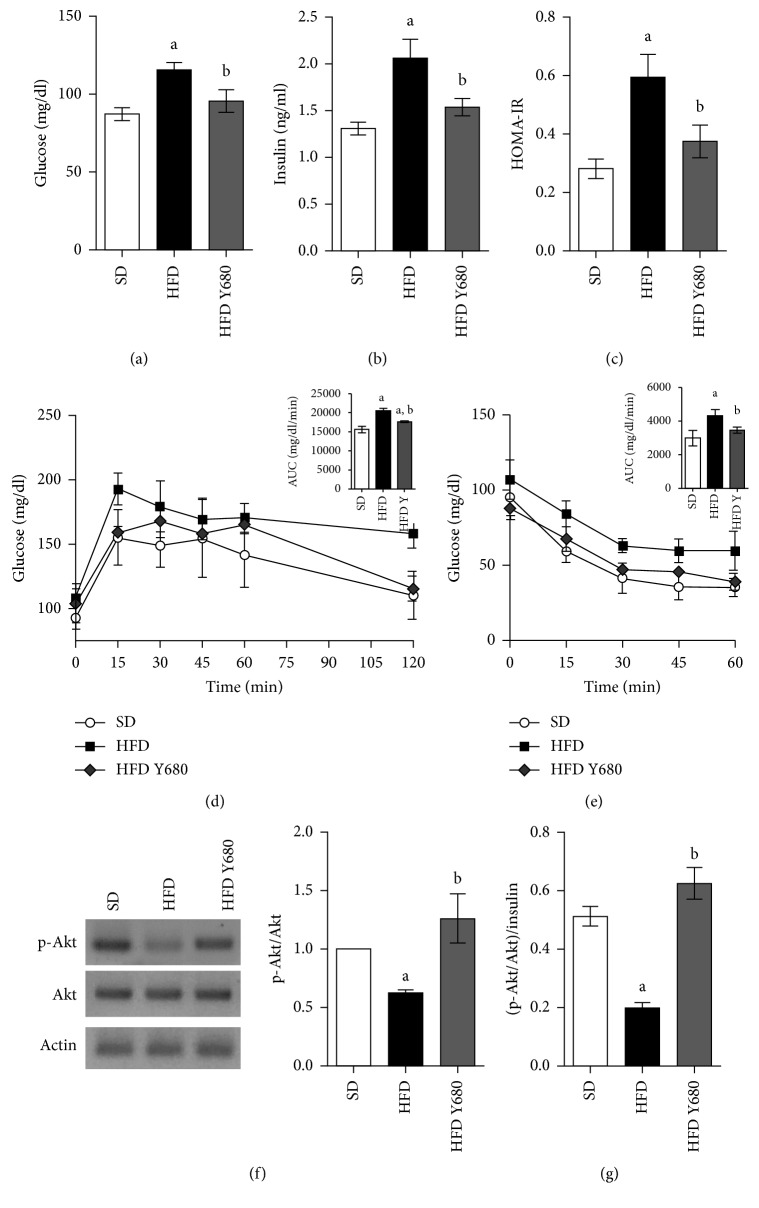
Figure 5.
Effects of yacon flour on HFD-induced metabolic disease. (a) Fasting glucose concentrations at the end of experiment. (b) Time course of glycemia in response to oral glucose overload (2 g/kg body weight) at 8 weeks (insert: area under the curve of blood glucose following glucose overload). (c) Time course of glycemia following a single intraperitoneal (i.p.) injection of insulin (0.75 U/kg b. w.) after 8 weeks of yacon supplementation (insert: area under the curve of blood glucose following insulin injection). (d) Fasting plasma insulin concentrations at the end of experiment. (e) Homeostasis model assessment of insulin resistance (HOMA-IR) index. (f) Akt and p-Akt protein expressions in visceral fat by western blotting. The mean value of SD-fed rats was set at 1. (g) p-Akt/Insulin ratio. Data are expressed as the mean ± standard deviation (n=6/group). a p < 0.05 vs. SD, b p < 0.05 vs. HFD. SD: standard diet-fed rats; HFD: high-fat-diet-fed rats; HFD SD: high-fat-diet-fed rats reversed to a SD chow; HFD SY680: high-fat-diet-fed rats reversed to a SD chow and supplemented with yacon flour (680 mg FOS/kg b. w.).

