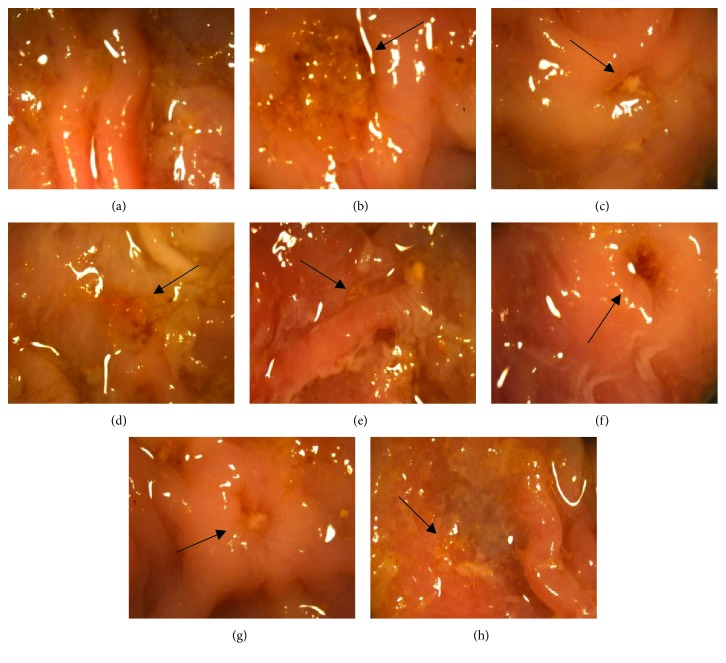
Figure 2.
Appearances of acetic acid-induced gastric ulcers in different groups: (a) the sham group treated daily with water, (b) an ulceration from the model group induced by acetic acid, (c–e) an ulceration from the BA-Zn group induced by acetic acid and treated daily with BA-Zn (3.25, 6.5, and 13 mg/kg, p.o.), (f) an ulceration from the BA group induced by acetic acid and treated daily with BA (4.6 mg/kg, p.o.), (g) an ulceration from the zinc-gluconate group induced by acetic acid and treated daily with zinc-gluconate (9.32 mg/kg, p.o.), and (h) an ulceration from the omeprazole group induced by acetic acid and treated daily with omeprazole (4.0 mg/kg, p.o.). Black arrows indicate ulcer location.

