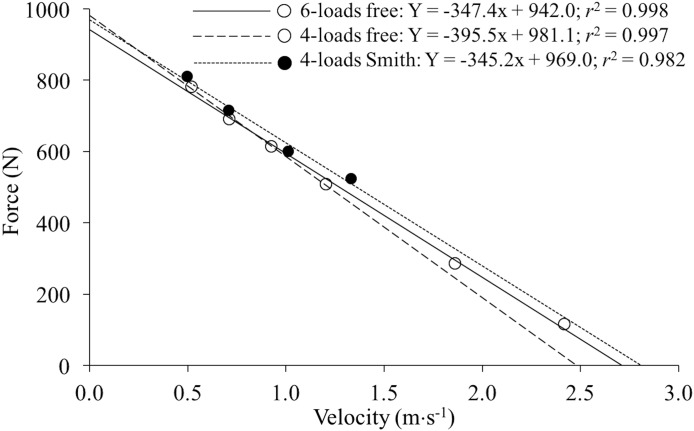
Figure 1. Individual force–velocity relationships of a representative subject obtained from the 6-loads free (empty dots and straight line), 4-loads free (empty dots and long dashed line) and 4-loads Smith (filled dots and short dashed line) methods.
The regression equations and the Pearson’s coefficient of determination (r2) are presented. Note that the points corresponding to the four heavy loads were the same for the 6-loads free and 4-loads free methods, while only the 6-loads method also considered the data of the two very light loads (one and eight kg).

