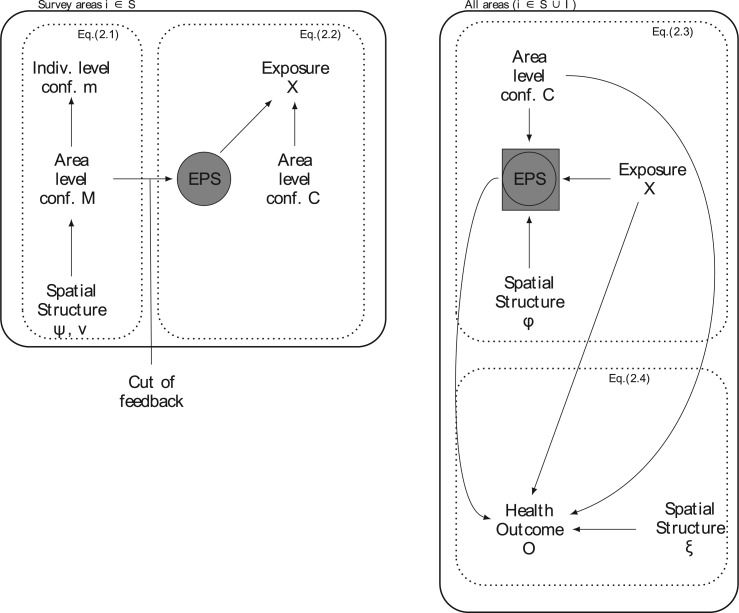
Fig. 1.
The figure represents the developed EPS framework. The left hand side corresponds to (2.1) and (2.2): the area level confounders  are estimated from the individual level confounders
  (2.1) and the EPS is estimated (2.2). Note that this model is only specified on the
  areas. EPS is represented by a circle as a latent quantity (not observed). The right hand side presents the EPS imputation and adjustment and is specified on
  : at the top the EPS is either obtained from (2.2) for
  and included as an observed quantity or missing for
  , imputed through the relationship with
  ,
,  , and the spatial structure (2.3) and included as a latent quantity. Thus the EPS is represented here as both a square and a circle as the combination of observed and latent quantities. At the bottom, the estimated and imputed EPS is included in the analysis model (corresponding to (2.4)) to provide confounder adjustment when assessing the effect of
  on
on  . Note that the right hand side is separated from the left hand side as the EPS estimation is carried out disjointly from the imputation and adjustment (no feedback from the latter to the former). At the same time the imputation and adjustment are jointly carried out so that feedback is allowed from
  to influence the EPS imputation.

