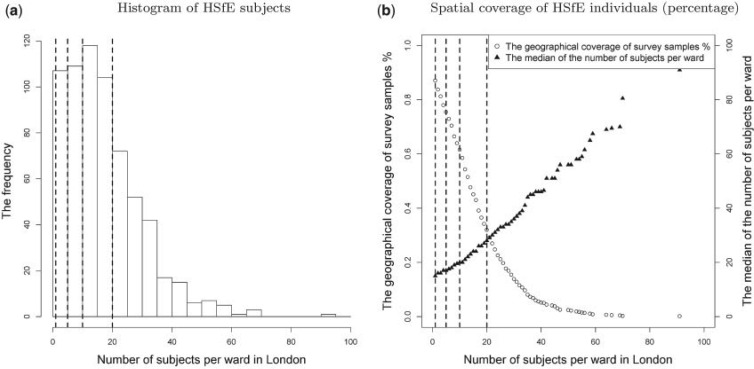
Fig. 2.
HSfE distribution and coverage in Greater London: (a) the number of surveyed subjects per ward; (b) the trade-off between spatial coverage and number of sampled individuals. The four dashed lines represent the thresholds considered for estimating/imputing EPS (1, 5, 10, and 20 subjects per ward).

