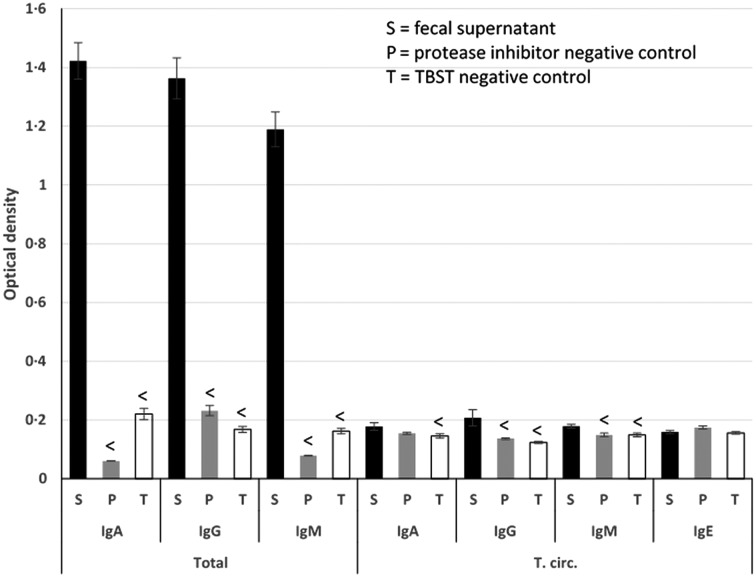
Fig. 3.
Unadjusted, ‘raw’ optical densities for fecal supernatant, protease inhibitor-negative controls and TBST-negative controls, across all assays. Less than symbols (<) above control columns signify that their ODs are statistically significantly less than the sample ODs for the same antibody, as determined by a two-sample t-test.

