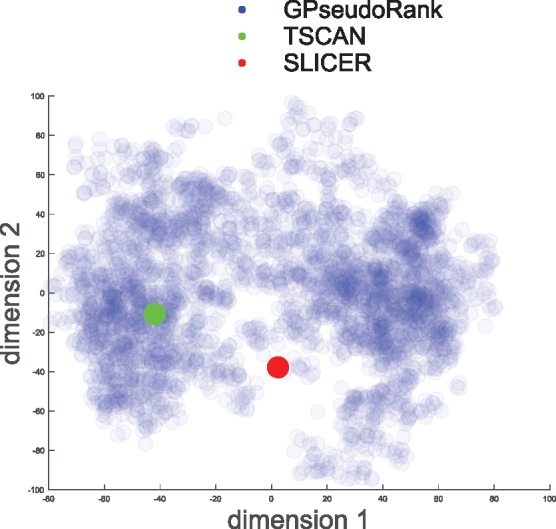
Fig. 1.

Shalek data. Multi-dimensional scaling. Distribution sampled with GPseudoRank, point estimates with TSCAN and SLICER. Each dot corresponds to one vector of cell positions from the posterior distribution. Semi-transparency of the points allows identification of ares of higher density, that is local modes of the posterior distribution
