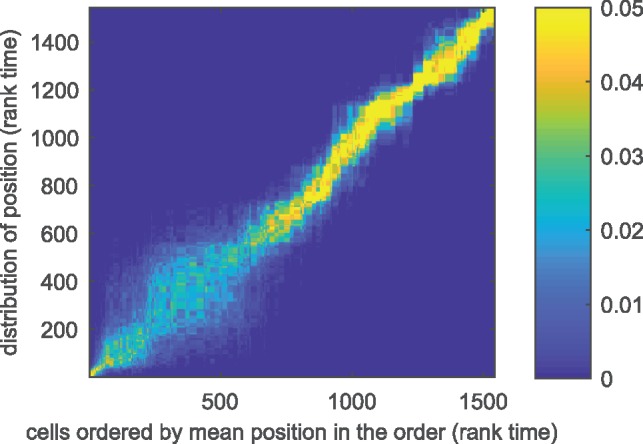
Fig. 6.

Klein data. Posterior distribution of cell positions. Posterior probabilities of the positions of the cells in terms of rank time: the mean cell position is along the x-axis, the posterior density is plotted along the y-axis. Larger uncertainty of cell positions in the early stages indicates metastable state
