
Fig. 3.
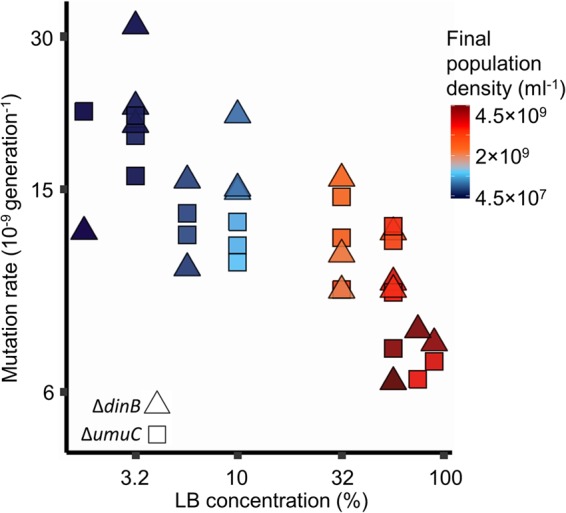
Effect of nutrient availability on mutation rates to rifampicin resistance in cells without error-prone polymerases Pol IV (ΔdinB, N = 18, triangles) and Pol V (ΔumuC, N = 18, squares). Cells were grown in Davis minimal medium mixed with 1–90% of lysogeny broth (LB) medium. The mutation rates of the two strains are not distinguishable (likelihood ratio test of the effect of genotype [N = 36, LR9,8 = 2.6, P = 0.11]). There is no evidence of a nonlinear relationship of log mutation rate with nutrient availability (likelihood ratio test of a quadratic effect [N = 36, LR8,7 = 0.15, P = 0.70]), but there is a highly significant linear effect of nutrient availability (likelihood ratio test of a linear effect [N = 36, LR7,6 = 45, P = 1.6 × 10⁻¹¹]), see model S-III in Supplementary Information. Colours represent final population density measured by colony-forming units (see Fig. S2 for details). See Figure S8 for an equivalent plot using final population density and S12 for mutation rates co-estimated with the relative fitness of resistant mutants. Note the nonlinear axes