Fig. 3.
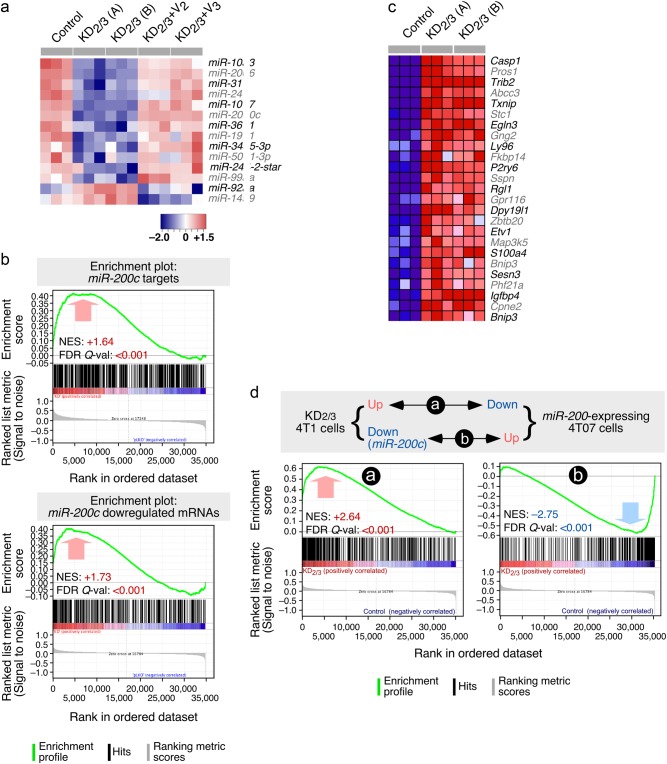
The Vav coding transcriptome and microRNAome are linked to EMT programs. a Heatmap of the microRNAs that are up- (red) and downregulated (blue) in indicated 4T1 cell lines (top). Triplicates for each cell line (columns) are shown. Relative changes in abundance are shown in color gradients according to the scale shown at the bottom. b GSEA showing the overlap of the Vav-regulated 4T1 cell transcriptome with the miR-200c-dependent transcriptome previously described in endometrium (top) and breast (bottom) cancer cells. The normalized enrichment scores (NES) and false discovery rate values (FDR, using q values) are indicated inside each GSEA graph. Q-val, q value. c Heatmap showing the expression of the top 25 leading-edge genes that show overlap between the miR-200c- and Vav2;Vav3-dependent transcriptome in indicated cell lines (top). Changes in abundance are plotted as in a. d Top panel, scheme of the similarities expected according to the mechanistic model proposed in this study. Bottom panels, GSEAs showing the similarities of the transcriptomal subsets indicated in top. The NES and FDR values are shown inside each graph as indicated in Fig. 3b. Red and blue values represent positive and negative correlation between the two analyzed transcriptomes

