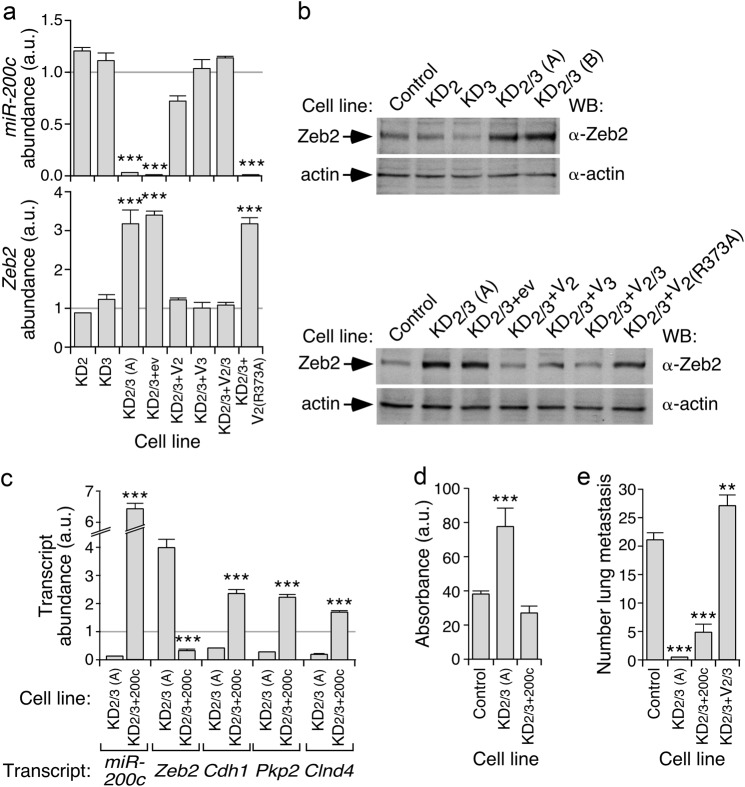
Fig. 4.
Vav2 and Vav3 regulate the miR-200c–Zeb2 axis in 4T1 cells. a qRT-PCR showing the abundance of miR-200c (top) and Zeb2 mRNA (bottom) in indicated 4T1 cell lines. Expression values are plotted relative to the levels of the indicated transcript in the parental cell line (which was given an arbitrary value of 1 and represented in the figure as a gray horizontal lane). ***P ≤ 0.001 (n = 3 independent experiments, each performed in triplicate). a.u., arbitrary units. b Representative immunoblot showing the abundance of Zeb2 and actin (loading control) in indicated cell lines (top) (n = 3 independent experiments). c qRT-PCR showing the abundance of indicated miR-200c and specific transcripts (bottom) in indicated 4T1 cell derivatives. Expression values are plotted as in a. ***P ≤ 0.001 (n = 3 independent experiments, each performed in triplicate). d Response of indicated 4T1 cell derivatives (left) to doxorubicin (500 ng/ml). Values represent the variation relative to untreated cells (which was given an arbitrary value of 100). ***P ≤ 0.001 (n = 3 independent experiments, each performed in triplicate). e Metastasis formed in the lung by the indicated intravenously injected cells. **P ≤ 0.01; ***P ≤ 0.001 (n = 4 animals/cell line)

