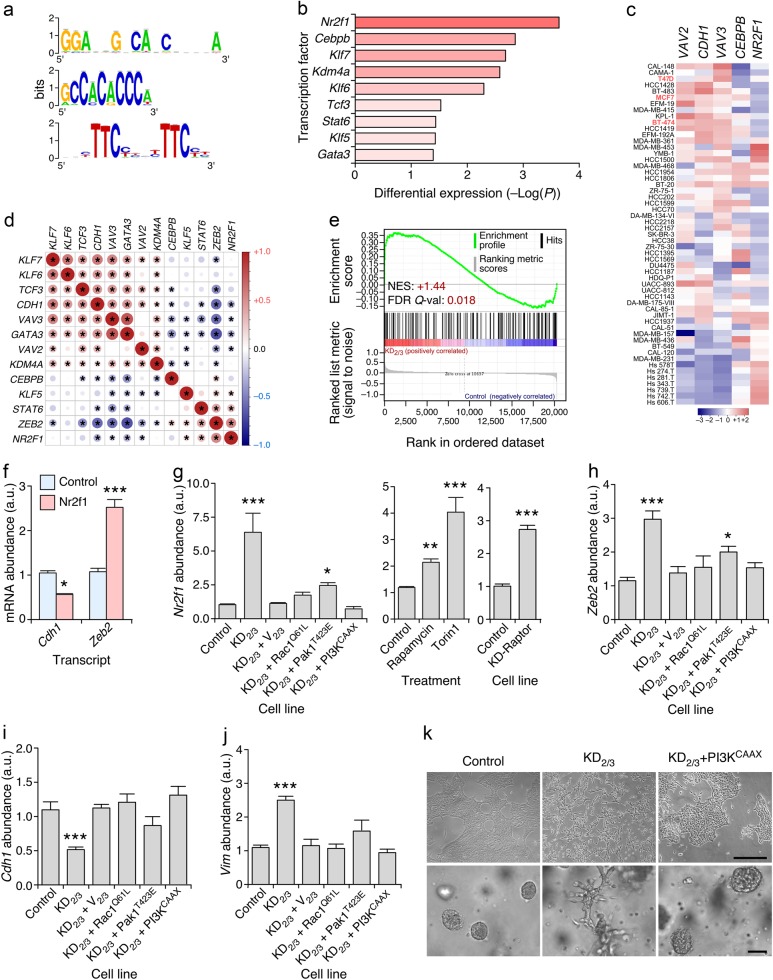
Fig. 5.
Vav proteins regulate epithelial morphology using a Rac1-dependent, PI3Kα-dependent, and Nr2f1-dependent mechanism. a Sequence logos of the transcription factor binding sites enriched in the promoter region of Vav-regulated microRNAs. b Changes in expression of the indicated transcripts in KD2/3 versus parental 4T1 cells according to microarray analyses [43]. c Abundance of indicated transcripts (top) in the Cancer Cell Line Encyclopedia collection of human breast cancer cell lines (left) [65]. In red, we show cell lines used in subsequent analyses (left). Changes in abundance are plotted as in Fig. 3a. d Expression correlation matrix of indicated transcripts in the human breast tumor samples present in the GSE65194 microarray dataset. Positive and negative correlation is shown in red and blue, respectively. The size and color intensity of circles are proportional to the Pearson correlation coefficient found for each transcript pair. Correlations with P values above the significance threshold of 0.05 have been labeled with an asterisk. e GSEA showing the enrichment of previously described Nr2f1 gene targets [38] in the Vav-regulated 4T1 cell transcriptome [43]. Further information about this type of analysis has been provided in the legend to Fig. 3b. f qRT-PCR-determined abundance of indicated transcripts (bottom) upon the transient expression of Nr2f1 in 4T1 cells. Expression values are plotted relative to the levels of the indicated transcript in the parental cell line (which was given an arbitrary value of 1). *P ≤ 0.05; ***P ≤ 0.001 (n = 3 independent experiments, each performed in triplicate). g Abundance of the Nr2f1 mRNA in indicated 4T1 cells and experimental conditions. Experiments were performed as in f. *P ≤ 0.05; ***P ≤ 0.01; ***P ≤ 0.001 (n = 3 independent experiments, each performed in triplicate). h–j Abundance of Zeb2 (h), Cdh1 (i), and Vim (j) transcripts in control and indicated 4T1 cell derivatives (bottom). Experiments were performed as in f. ***P ≤ 0.001 (n = 3 independent experiments, each performed in triplicate). k Representative example of the morphology of indicated 4T1 cell lines in 2D (top) and 3D (bottom) cultures (n = 3 independent experiments). Scale bars, 50 μm

