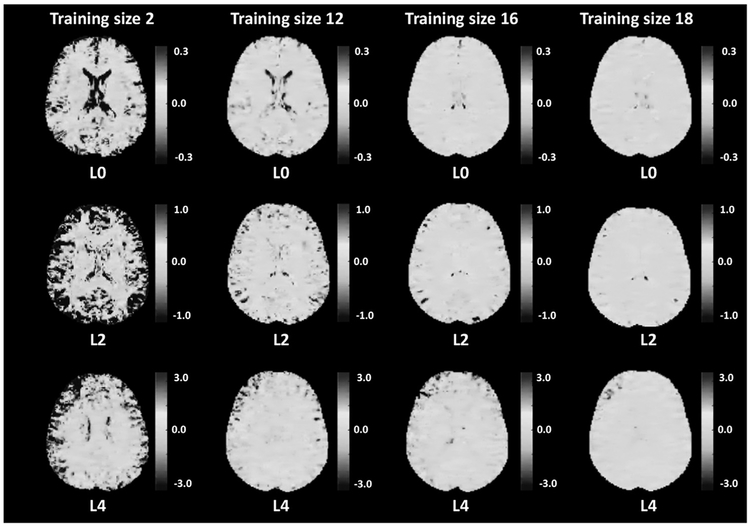
Figure A.1.
Grayscale figure of Fig. 5: Voxel-wise scale map differences between RISH feature scale map (L0, L2 and L4) estimated with a training size of 20 (as “gold standard”) and some representative training data size of 2, 12, 16 and 18 shown in each column respectively.

