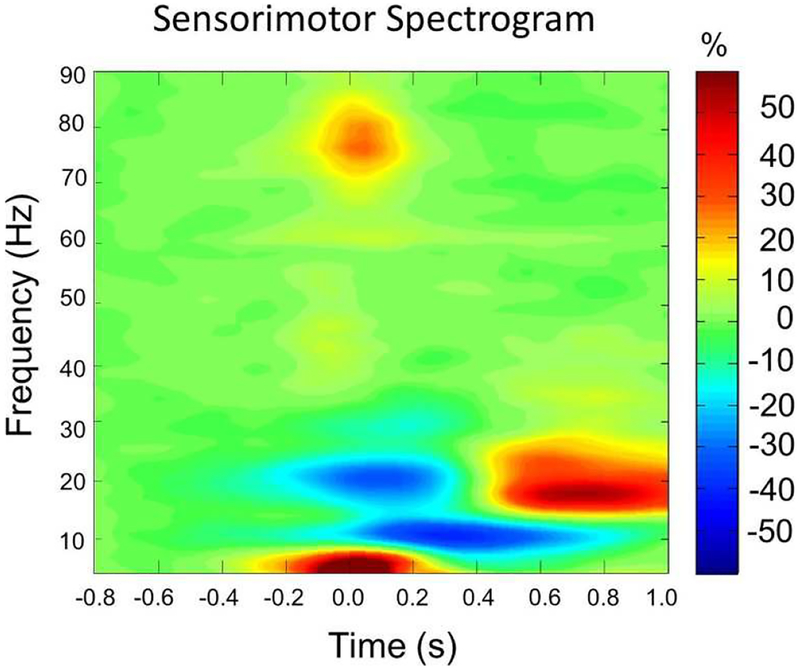
Figure 1.
Group-averaged time-frequency spectra from a gradiometer sensor located near the left sensorimotor cortices (the same sensor was selected in each participant). Time is denoted on the x-axis in seconds (s), with 0.0 s defined as movement onset. Frequency (in Hz) is shown on the y-axis. All signal power is expressed as a percent difference from baseline, with the color legend shown to the far right. Prior to and during movement, there was a strong beta event-related desynchronization (ERD) that occurred about −0.1 s before movement onset and persisted until about 0.3 s afterward. There was also a transient high-frequency gamma synchronization that began slightly before movement onset and quickly dissipated (-0.05 to 0.10 s). Finally, after movement termination, there was a post movement beta rebound (PMBR) response that extended from about 0.6 to 0.9 s. There also was an alpha ERD that began after movement onset (0.1 to 0.7 s), but this response was beyond our primary focus as it has commonly been linked to somatosensory activity. Of note, the low-frequency response centered near 0.0 s likely reflects the evoked response, as it was strongly phase-locked to movement onset. See Figure S2 in the supplementary materials for this spectrogram shown per age group.

