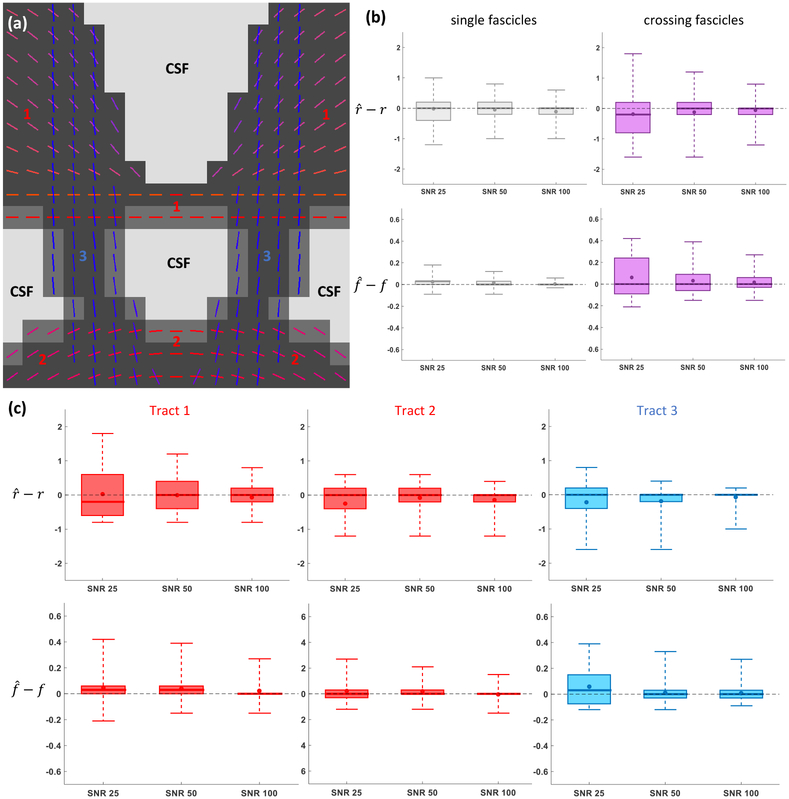
Figure 7: (Exp. 2.B) Tract-specific microstructural estimated enabled by Monte Carlo dictionary estimation.
(a) Color-coded direction of all three axonal tracts with the gray-scale background indicating the level of CSF contamination in each voxel. (b) Signed error made on the estimated radius index r and density index f in regions of single (left) and crossing (right) fascicles. (c) Signed errors for the local voxel fascicles of each tract independently. In (b)-(c), the whiskers of the boxplots extend from the minimum to the maximum value of the data.

