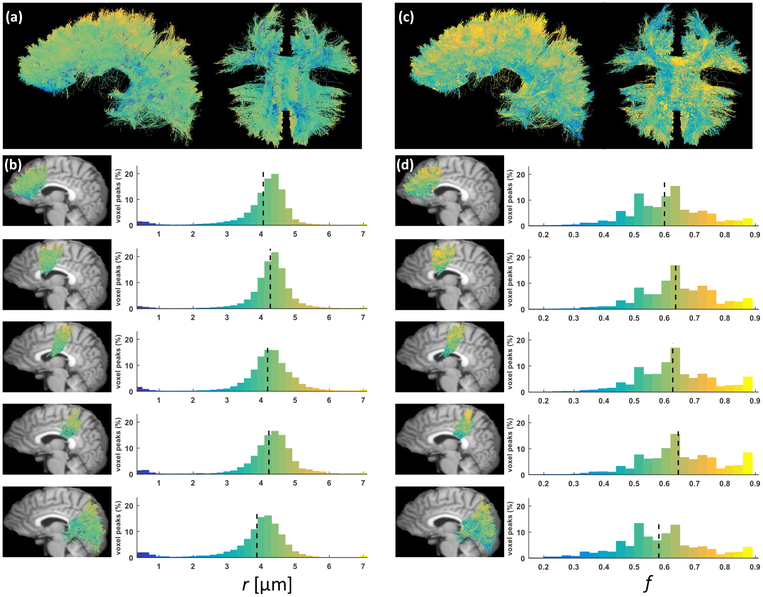
Figure 8: Spatially-smooth estimates of apparent radius and density indices obtained with Monte Carlo dictionary estimation.
(a) Left and inferior view of all the axons passing through the corpus callosum (CC), color-coded by the apparent axonal radius index r. (b) Histograms of estimated apparent radius index in the five axonal tracts studied in the experiment, respectively the anterior, mid-anterior, central, mid-posterior and posterior CC tracts. The mid-sagittal maps of color-coded axons are laid atop a referential T1 image warped into the DW-MRI space. (c)-(d) Same as (a) and (b) for the axonal density index f.

