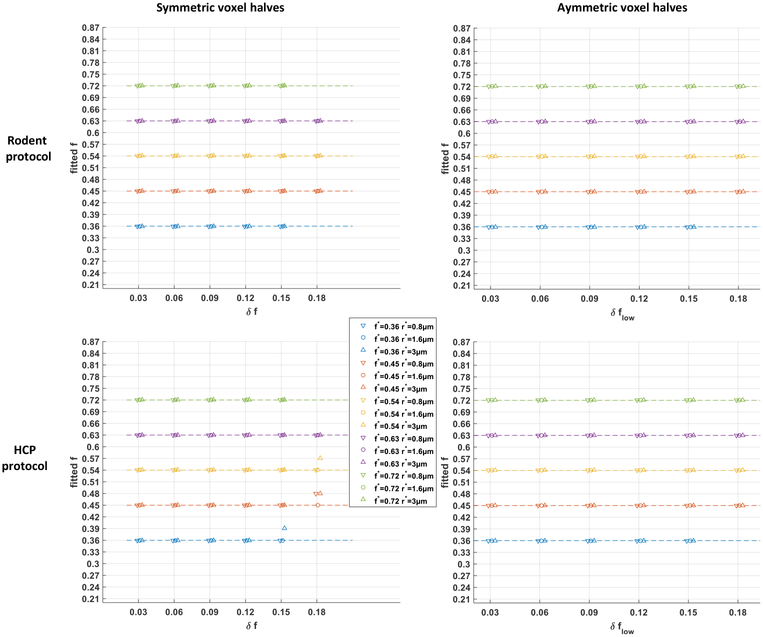
Figure B.9: Fingerprints assuming uniform microstructural configurations capture the average axonal packing density of non-uniform configurations.
Fitted axonal density index for groundtruth voxels containing two sub-regions of different axonal packing density, in a symmetric or asymmetric configuration, using the rodent protocol (Section 2.1.1) or the HCP protocol (Section 2.2.1). The missing data points correspond to scenarios in which one of the local density indices fell outside the range ]0.20, 0.90[.

