Fig. 3.

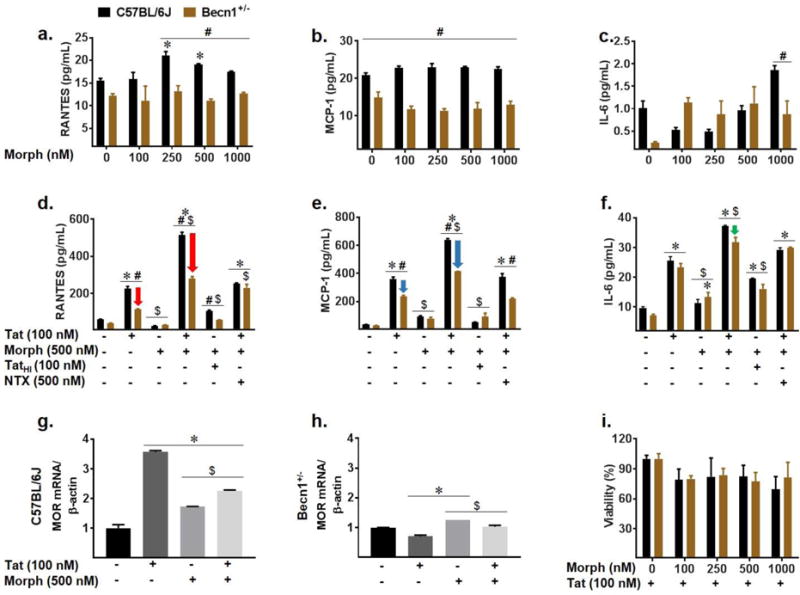
Tat and morphine induced inflammatory effects show contribution of Beclin1. Cell culture supernatants from C57BL/6J and Becn1+/− derived glia after indicated treatment for 24-hours were assessed for cytokine and chemokine secretion by ELISA (a–f). Cytokine secretion was assessed following 24-hour treatment with increasing concentrations of morphine: 100 nM, 250 nM, 500 nM, and 1000 nM (a–c). Tat and morphine co-exposure were assessed after 24-hours (d–f). Arrows indicate reduction in RANTES (d, red), MCP-1 (e, blue), and IL-6 (f, green) secretion from Becn1+/− derived glia relative to C57BL/6J derived glia for given treatment. Values were determined from standard curves and are presented as the mean ± SEM of 4 independent experiments. mRNA levels of murine μ-opioid receptor (MOR) were assessed by qRT-PCR following treatment with Tat and/or morphine (g–h). Values were determined by 2^-ΔΔCT method and normalized to β-actin. Toxicity of combined Tat and increasing concentration (100 nM, 250 nM, 500 nM, 1000 nM) of morphine in C57BL/6J and Becn1+/− derived glia was assessed by MTT assay. Data are presented as percent viability compared to Tat treated cells (i). Error bars show SEM for 3 independent experiments. P < 0.05 * vs. Control; # vs. C57BL/6J; $ vs. Tat
