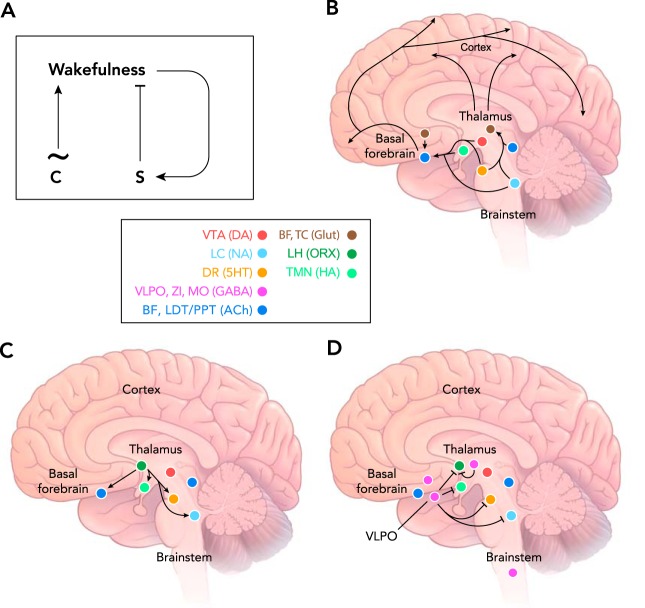
FIGURE 2.
Neuroanatomy of sleep control
A: two process model for control of the sleep/wake cycle by the circadian clock (process C) and the sleep homeostat (process S). The clock drives a cycling pattern of arousal with a period of ~24 h. Process S increases during waking until it exceeds a certain threshold, after which it discharges, leading to suppression of waking and initiation of sleep. B: wake-promoting loci in the mammalian brain, including neuromodulatory centers of the ascending reticular activating system. C: orexin neurons in the lateral hypothalamus excite wake-promoting loci to stabilize the waking state. D: GABAergic inhibition of wake-promoting loci and other unknown targets promotes sleep. Color-coded key: BF, basal forebrain; TC, thalamocortical relay neurons; LH, lateral hypothalamus; VTA, ventral tegmental area; LC, locus coeruleus; DR, dorsal raphe nucleus; VLPO, ventrolateral preoptic nucleus; ZI, zona inserta of the subthalamus; MO, medulla oblongata; LDT/PPT, laterodorsaltegmental and pedunculopontine nuclei. Glut, glutamate; ORX, orexin; HA, histamine; DA, dopamine; NA, noradrenaline; 5HT, serotonin; ACh, acetylcholine.

