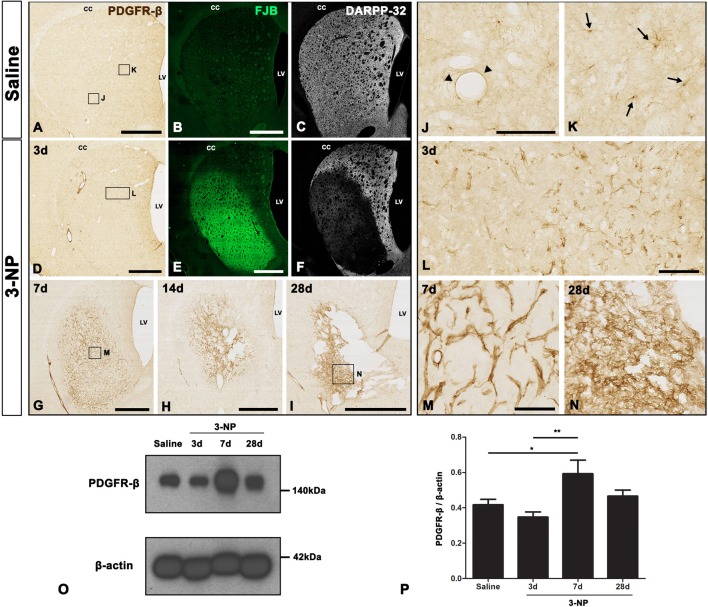
Figure 1.
Temporal expression of platelet-derived growth factor receptor beta (PDGFR-β) in control and lesioned striatum after 3-nitropropionic acid (3-NP) injection. (A–N) Lower- (A–I) and higher- (J–N) magnification views of representative coronal sections from saline-treated control rats and rats subjected to 3-NP treatment. (A–C,J,K) Weak immunoreactivity for PDGFR-β is observed in the control striatum, where no specific staining for Fluoro-Jade B (FJB) is seen, but 32 kDa dopamine- and cyclic AMP-regulated phosphoprotein (DARPP-32)-positive striatal neurons are prominent. Higher magnification images reveal PDGFR-β expression in vascular profiles (arrowheads in J) and cells with thin and ramified processes (arrows in K). (D–F,L) On day 3 post-lesion, vessel-associated PDGFR-β immunoreactivity is evident in the core of a lesion in the lateral part of the striatum, which is clearly distinguished by intense FJB staining and concomitant loss of DARPP-32-positive neurons. (D–I,M,N) At days 7 (G,M), 14 (H) and 28 (I,N), PDGFR-β expression seems to become more densely distributed in the lesion core over time. At 28 days, PDGFR-β expression appears to form a network in the lesion core, and shrinkage of the striatum is prominent. CC, corpus callosum; LV, lateral ventricle. (O) Representative immunoblot analysis for PDGFR-β in microdissected striatum of saline-treated controls (Saline) and 3-NP-treated rats at 3, 7 and 28 days post-lesion. A band is present at 140 kDa, corresponding to the PDGFR-β protein. (P) Quantification of PDGFR-β protein expression. Data are obtained by densitometry and are normalized using β-actin as the loading control. The intensity of PDGFR-β protein expression in the lesioned striatum significantly increases at 7 days after 3-NP administration, and then declines, although enhanced expression levels persist until at least day 28. Relative optical densities of the protein bands were measured in triplicate in each of three animals at each time point. Data are expressed as mean ± SEM. *P < 0.05; **P < 0.01 vs. saline-injected controls and the day 3 data. Scale bars = 1 mm for (A–I); 100 μm for (J–N).

