Figure 2.
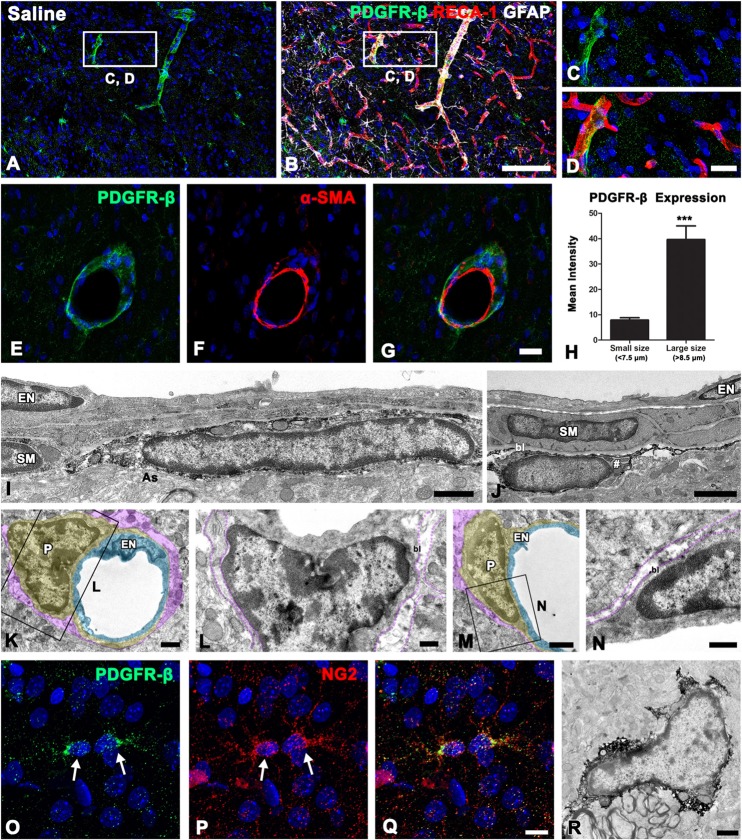
PDGFR-β expression profiles and their spatial relationship with vasculature in the control striatum. (A–D) Triple-labeling for PDGFR-β, glial fibrillary acidic protein (GFAP), and the endothelial cell marker RECA-1 in the control striatum, showing that PDGFR-β expression is localized in vascular profiles with a larger caliber, but not in capillary-like microvessels. The boxed areas in (A,B) are enlarged in (C,D), respectively. (E–G) Double-labeling for PDGFR-β and the smooth muscle cell marker α–smooth muscle actin (α–SMA), showing that PDGFR-β expression does not colocalize with α–SMA, but is localized along the outer part of smooth muscle cells. (H) Quantitative analysis of the intensity of PDGFR-β immunoreactivity over the microvessels (<7.5 μm) and larger vessels (>8.5 μm) in the control striatum. Note that the intensity of PDGFR-β immunoreactivity in larger vessels is significantly higher than that in the capillaries. The data are expressed as the mean ± SEM. ***P < 0.001 vs. microvessels. (I–N) Ultrastructural analysis of PDGFR-β-positive cells associated with the venule (I) and arteriole (J) in the control striatum. PDGFR-β-positive cells have elongated or flattened nuclei and thin processes that invariably lie between the smooth muscle (SM) cells and the glia limitans (as in A), containing intermediate filaments (arrow in I) in venules (I) and arterioles (J). Note that smooth muscle cells and endothelial cells (EN) are devoid of PDGFR-β. (K–N) No specific PDGFR-β immunoreactivity can be detected in capillaries that consist of a single layer of (EN; light blue) and pericytes (P; yellow). Note that the basal lamina (bl) surrounding pericytes is in direct contract with the glia limitans (magenta). (O–Q) Double-labeling for PDGFR-β and NG2, showing that both are colocalized in small stellate cells with fine processes (arrowheads). (R) Parenchymal PDGFR-β-positive cells have scarce cytoplasmic organelles and several processes. Cell nuclei are stained with DAPI. Scale bars = 100 μm for (A,B); 20 μm for (C–G); 10 μm for (O–Q); 1 μm for (I–K,M,R); 0.5 μm for (L,N).

