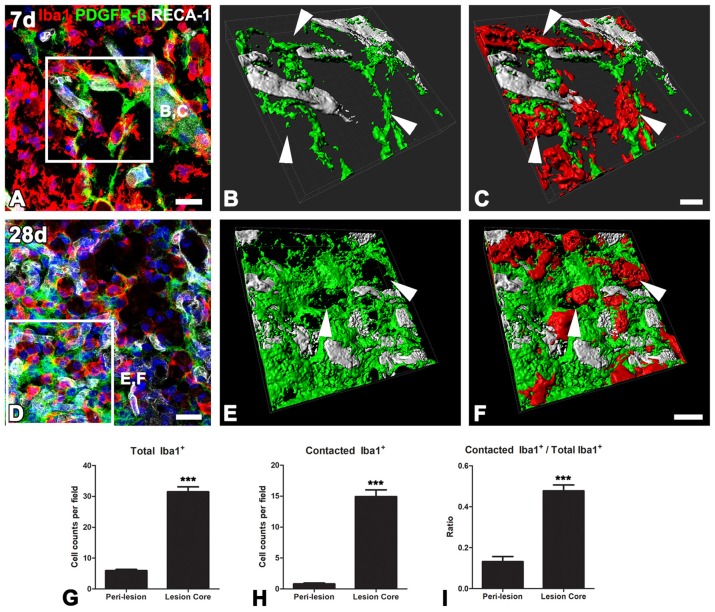
Figure 7.
The close relationship between PDGFR-β-positive cells and activated microglia/macrophages in lesioned striatum. (A–F) Triple labeling for PDGFR-β, Iba1 and RECA-1 at days 7 (A–C) and 28 (D–E) post-lesion, showing that activated microglia/macrophages are in close proximity to a PDGFR-β-positive cell with highly branched processes. (B,C,E,F) Three-dimensional images with confocal microscopy of the boxed areas in (A,E), respectively. White arrows in (B,C,E,D) denote the close contact points between both cells. (G–I) The numbers of total microglia/macrophages (G) and microglia/macrophages contacting PDGFR-β-positive cells (H) and the proportion of contacting microglia/macrophages (I) in the lesion core and peri-lesional area on day 7 post-lesion. Note that the numbers of both populations of microglia/macrophages and their proportion are significantly higher in the lesion core than in the peri-lesional area. The data are expressed as the mean ± SEM. ***P < 0.001 vs. the peri-lesional area data. Scale bars = 20 μm for (A,D); 10v μm for (B,C,E,F).

