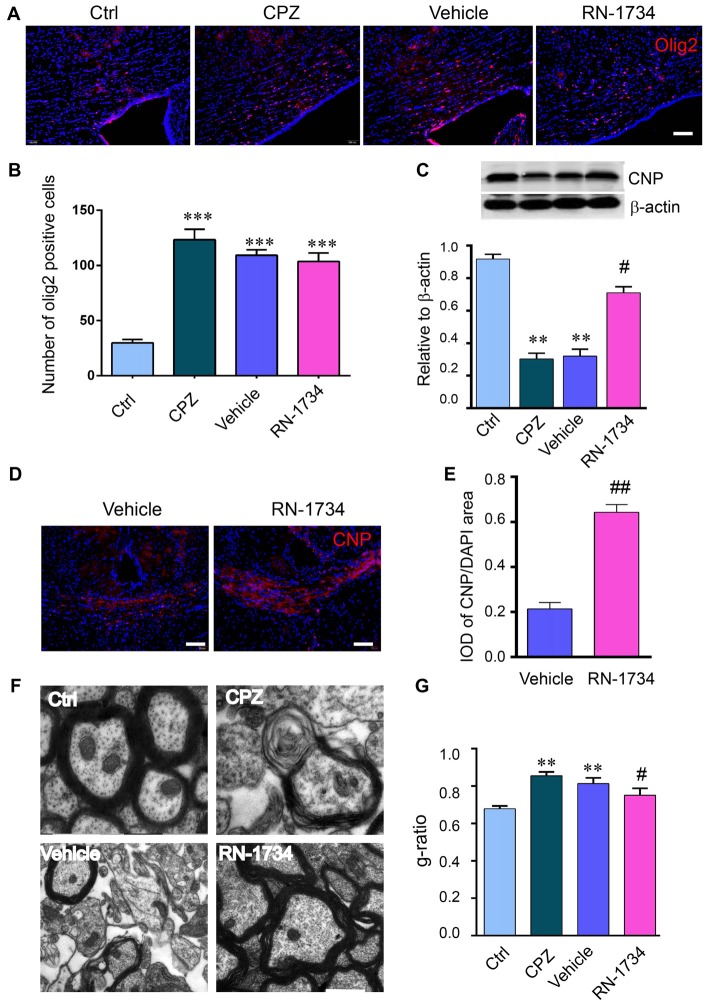
Figure 2.
Inhibition of TRPV4 activity alleviated demyelination induced by CPZ. (A,B) Images and quantitative analysis of olig2 immunostaining cells in the Ctrl, CPZ, vehicle-treated (vehicle) and RN-1734-treated (RN-1734) groups (n = 4). Scale bar = 50 μm. (A–C) Western blot analysis of the corpus callosum CNP in the control, CPZ, vehicle and RN-1734 groups (n = 3). (B–E) Immunofluorescence and quantitative analysis of CNP-positive cells in the vehicle group and the RN-1734 group (n = 4). Scale bar = 50 μm. (D–F) Representative images from electron microscopy of the corpus callosum in the control, CPZ, vehicle and RN-1734 groups. (E–G) Quantitative analysis of the g-ratio of the myelin sheath (n = 3). Scale bar = 500 nm. The data are shown as the mean ± SEM. **P < 0.01, ***P < 0.001 vs. the Ctrl group; #P < 0.05, ##P < 0.01 vs. the vehicle group.

