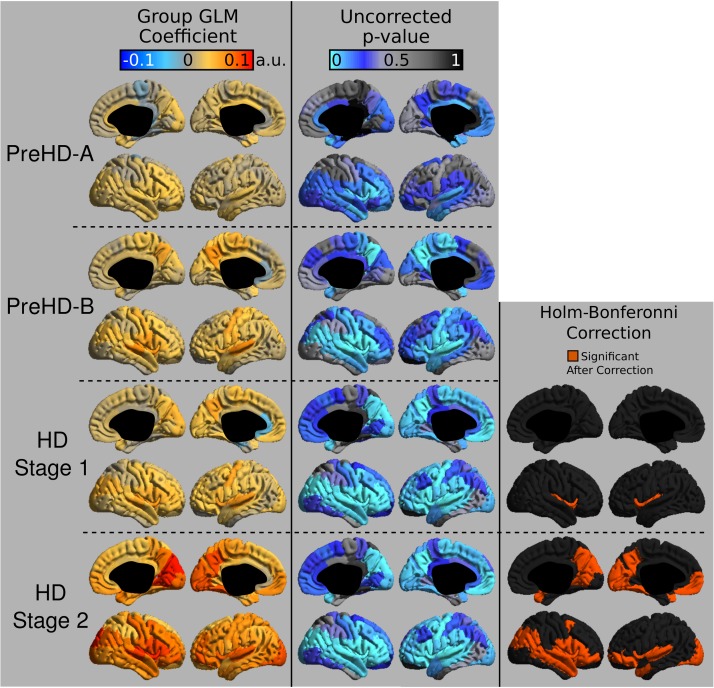
FIGURE 2.
T1W/T2W ratio changes in HD. Coefficients from the intracortical signal analysis are mapped onto the cortex (left), illustrating the difference in ratio signal relative to controls with effects of age and imaging site regressed out of the signal. Uncorrected p-values generated for each group from the linear models are mapped onto the cortex for each region to visualize trends in changing intracortical signal (middle). Changes in intracortical signal that are significant following multiple comparison correction are found in HD Stage 1 and 2 (right).

