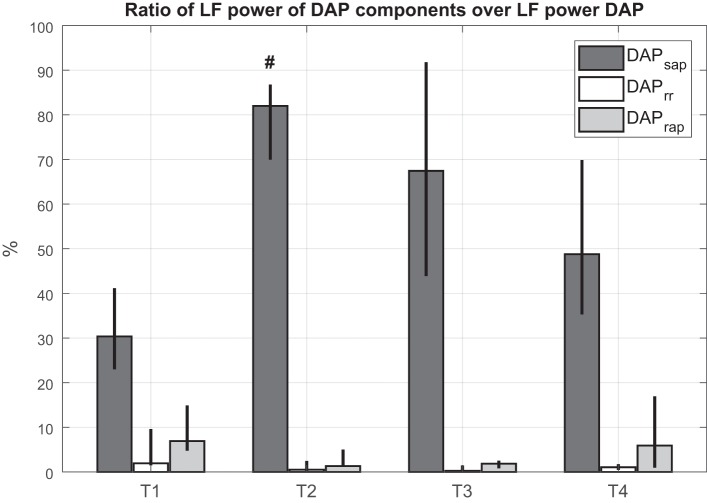
Fig. 2.
Ratio between low-frequency (LF) absolute power of each predicted component and LF absolute power of diastolic arterial pressure (DAP) at each time point for hemorrhagic shock animals. Column height is median value for the population; black bars indicate values of 25th and 75th percentiles. T1, baseline; T2, after development of shock; T3, after fluid and vasopressor resuscitation; T4, after blood reinfusion; SAP, systolic arterial pressure; RR, R-R interval. #P < 0.05 vs. T1 (Friedman test).

