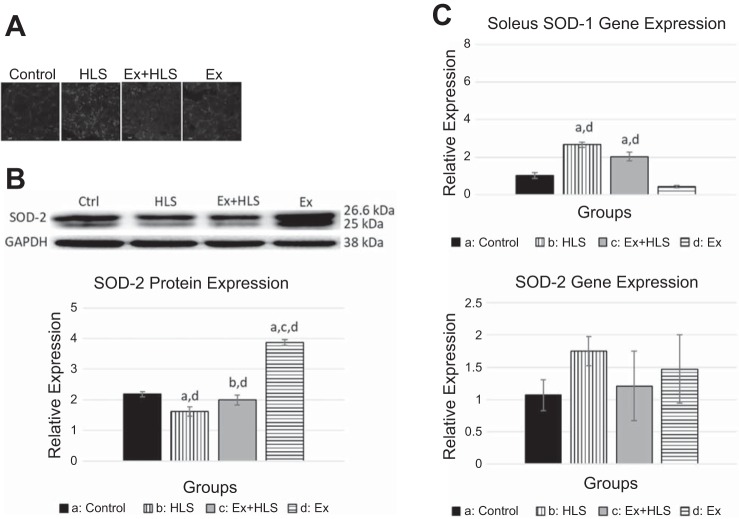
Fig. 6.
A: observational soleus dihydroethidium staining for ROS. Bright spots are assumed to be positive staining for superoxide anion (n = 4). HLS, hindlimb suspension; Ex, exercise. B: soleus protein expression via Western blot analysis for antioxidant enzyme superoxide dismutase-2 (SOD-2). Statistical significance (P < 0.05) between groups indicated by the corresponding group letter. C: soleus SOD-1 and SOD-2 gene expression via qPCR. (groups: n = 6, P < 0.05, means ± SE).

