FIGURE 2.

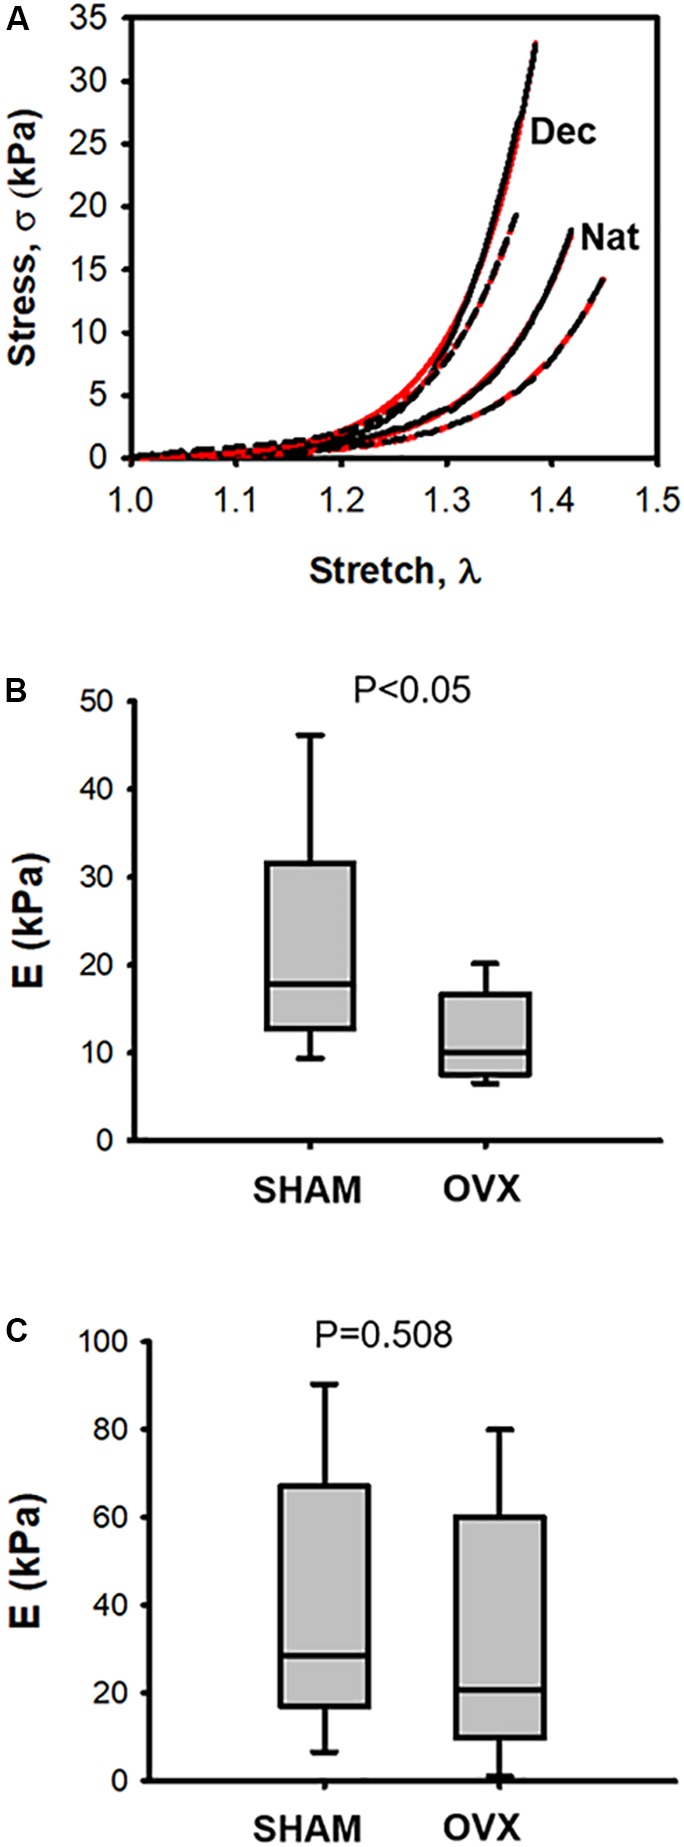
(A) Examples of stress–stretch curves in native (Nat) and decellularized (Dec) left ventricular myocardium tissue samples from one ovariectomized mouse (OVX; black dotted line) and from one intact mouse (SHAM; black solid line). Red solid and dashed lines correspond to exponential fits to the OVX and SHAM stress-stretch curves, respectively. (B) Passive Young’s modulus (E) of native left ventricular myocardium tissue computed at stretch λ = 1.2 in ovariectomized (OVX) and intact (SHAM) mice. (C) same as (B) in decellularized tissue (N = 8).
