
Figure 5.
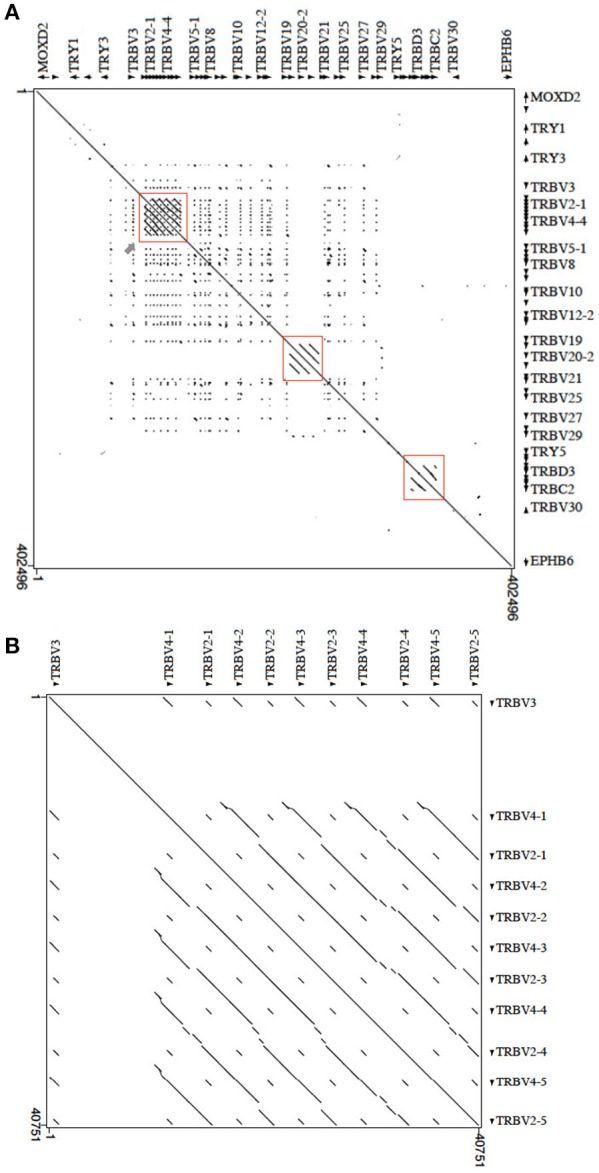
Dot-plot of the pig TRB locus sequence against itself. (A) With the exception of the main diagonal, the dots and diagonal lines indicate internal homology units in the sequence. The red boxes show the two TRBV regions underwent to duplication events and the internal homology of the D-J-C cluster portion. The gray arrow points to the homology region enlarged in (B). (B) The pattern of parallel lines indicates the duplicated region of about 28 kb containing the TRBV2 and TRBV4 genes.