
Figure 6.
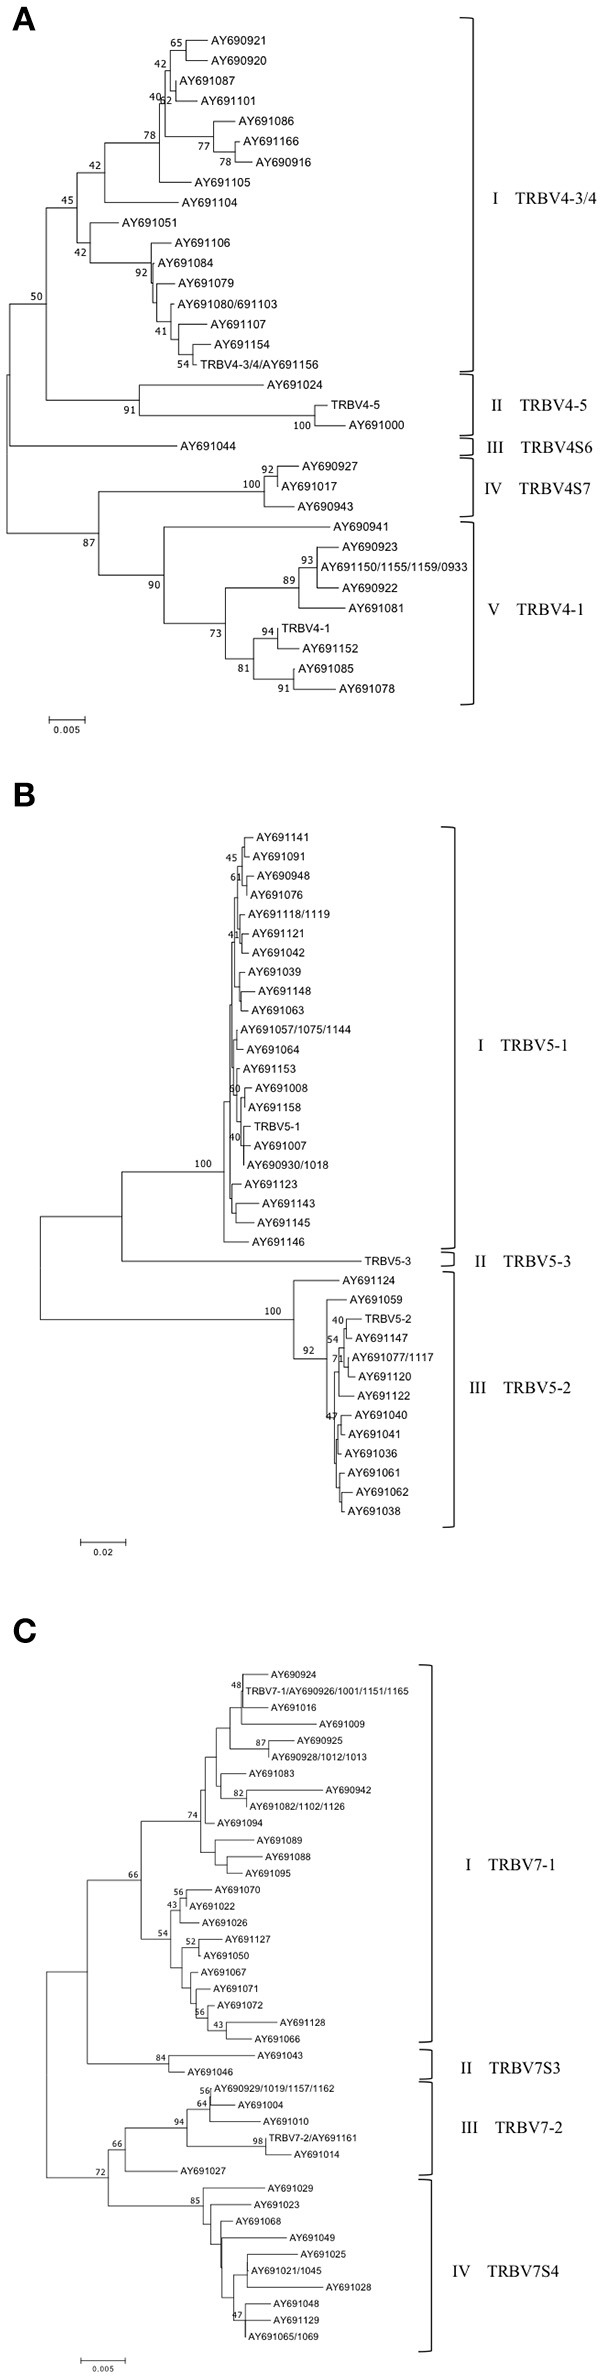
Evolutionary relationship of the TRBV4 (A), TRBV5 (B) and TRBV7 (C) genes. The evolutionary history was inferred using the Neighbor-Joining method (21). The percentage of replicate trees in which the associated genes clustered together in the bootstrap test (100 replicates) are shown next to the branches (24). The trees are drawn to scale, with branch lengths in the same units as those of the evolutionary distances used to infer the phylogenetic trees. The evolutionary distances were computed using the p-distance method (22) and are in the units of the number of base differences per site. The analysis involved 33 (in A), 35 (in B) and 41 (in C) nucleotide sequences. Codon positions included were 1st+2nd+3rd+Noncoding. All positions containing gaps and missing data were eliminated. There were a total of 333 (A,B) and 348 (C) positions in the final dataset. The evolutionary analyses were conducted in MEGA7 (20).