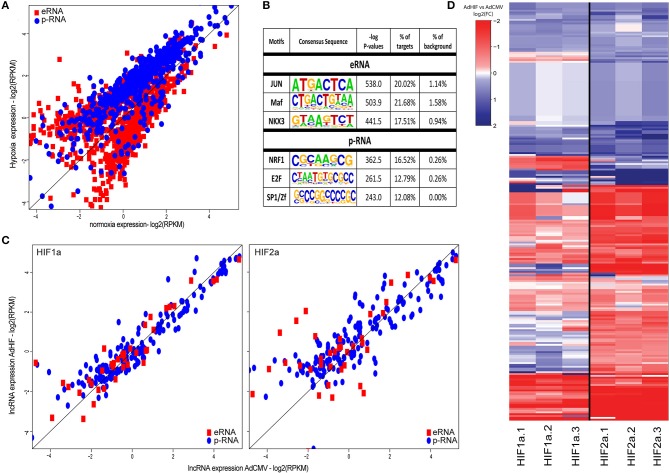
Figure 2.
(A) Scatter plot of the expression values (log2 RPKM) of differentially expressed lncRNAs in response to hypoxia (FDR < 5%). Red squares represent lncRNAs exhibiting high H3K4me1 signal (eRNAs), blue dots represent lncRNAs exhibiting high H3K4me3 signal (p-RNAs). (B) DNA-binding motif enrichment analysis at the transcription start sites of the two lncRNA categories (±500 bp). All differentially regulated lncRNAs were used as background. (C) Scatter plot showing the nascent lncRNA expression (log2 RPKM of GRO-Seq signal) after adenoviral overexpression of constitutively active forms of HIF1α or HIF2α compared to adenovirus without transgene (AdCMV). Red squares represent eRNAs, blue dots represent p-RNAs. (D) Heatmap showing the log2(FC) of the lncRNAs after adenoviral overexpression of HIF1α or HIF2α compared to adenoviral overexpression of CMV based on RNA-Seq. Rows are hierarchically clustered using Ward's least absolute error with Euclidian distance.

