FIGURE 3.
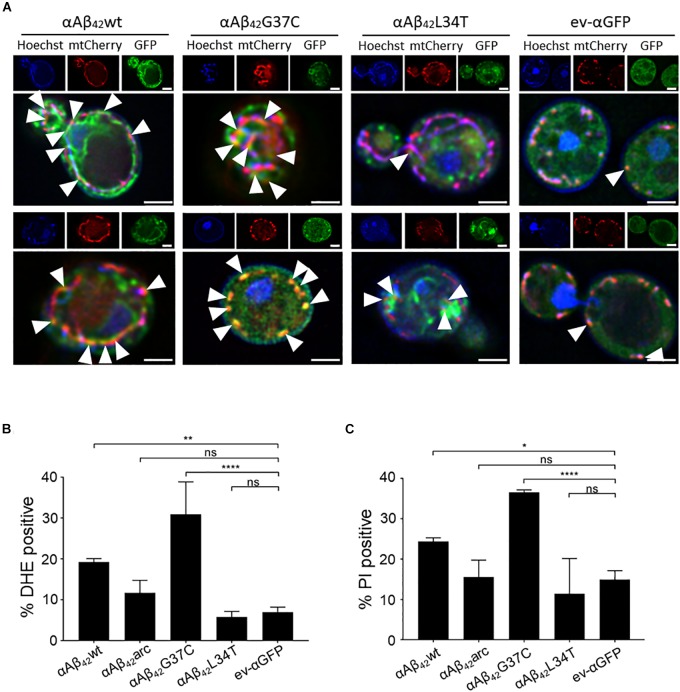
αAβ42 induces mitochondrial dysfunction and cell demise. (A) Fluorescence microscopy pictures suggesting partial co-localization of toxic αAβ42 but not of the non-toxic αAβ42L34T nor of the αGFP control (green) with mitochondria (red) in wild-type cells. Hoechst staining (blue) shows mitochondrial as well as nuclear DNA. The white arrowheads indicate sites of co-localization between αAβ42 and mitochondria. Two single cells shown per strain. Scale bars represent 2 μm. Percentage of wild-type yeast cells expressing wild-type or mutant αAβ42 and a control stained with DHE as a marker for ROS-formation (B) or PI as a marker for plasma membrane integrity (C). ∗P ≤ 0.05; ∗∗P ≤ 0.01; ∗∗∗∗P ≤ 0.0001; nsP > 0.05.

