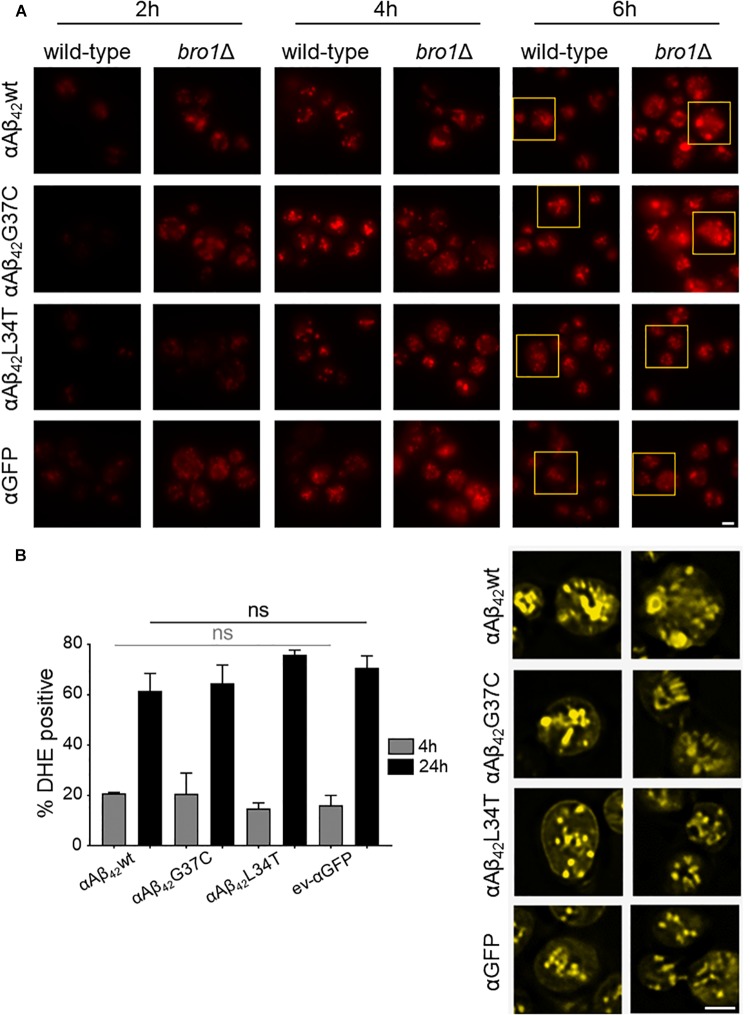
FIGURE 6.
αAβ42 instigated lipid droplet biogenesis. (A) Nile Red stainings (top panel), a marker for lipid droplets, of wild-type and the bro1Δ cells expressing αAβ42wt, αAβ42G37C, or αAβ42L34T or αGFP after 2, 4, or 6 h growth on galactose-containing medium. The bottom panel (yellow) shows magnifications and deconvolved parts of the top-panel pictures at time point of 6 h. Note that due to deconvolution the picture intensities are enhanced. Scale bars represent 2 μm. (B) DHE staining of cells deleted for BRO1 transformed with constructs allowing for expression of αAβ42wt, αAβ42L34T, αAβ42G37C, or αGFP after 4 or 24 h growth on galactose-containing medium. Error bars represent standard deviations of at least four independent transformants.

