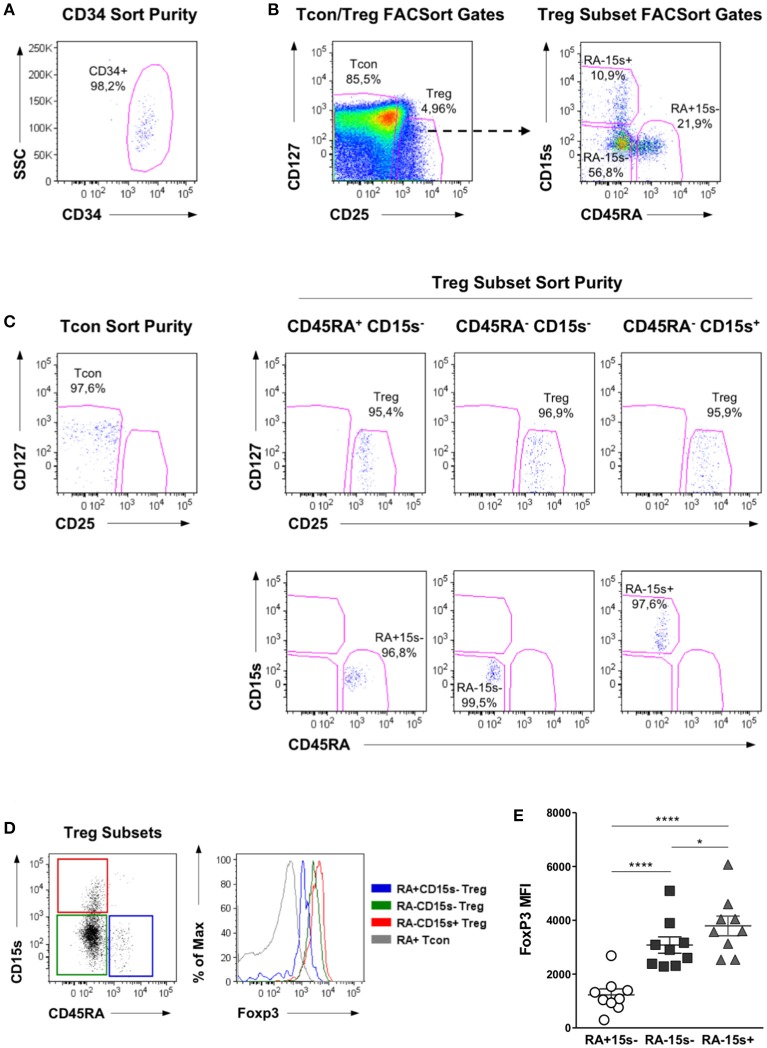
Figure 1.
Flow cytometry analysis and purification strategy of Treg, Tcon, and CD34 cell populations. (A) Purity of CD34+ cells after FACSorting. Representative dot plot showing the frequency of CD34+ cells within a live cell gate, as determined by FSC and SSC analysis. (B) Representative dot plots showing the gating strategy for the isolation of Treg and Tcon cells by FACSort. Firstly, FSC and SSC analysis was used to identify lymphocytes and to exclude doublets. Treg cells were isolated as CD3+CD4+CD25BrightCD127Low and Tcon as CD3+CD4+CD25Low cells. Treg were further gated into CD45RA+CD15s− (naïve Treg), CD45RA−CD15s− (non-suppressive Treg-like cells), and CD45RA−CD15s+ (eTreg). (C) Representative dot plots showing the purity obtained for each T cell population after FACSort. (D) FoxP3 expression levels within CD45RA/CD15s Treg subpopulations, as well as within naïve Tcon cells. A representative overlay of Foxp3 expression within these T cell populations is shown. (E) Median Fluorescence Intensity (MFI) of FoxP3 within Treg subpopulations for all individuals analyzed. Asterisks denote statistically significant differences between groups (*p = 0.01–0.05; ****p < 0.0001).

