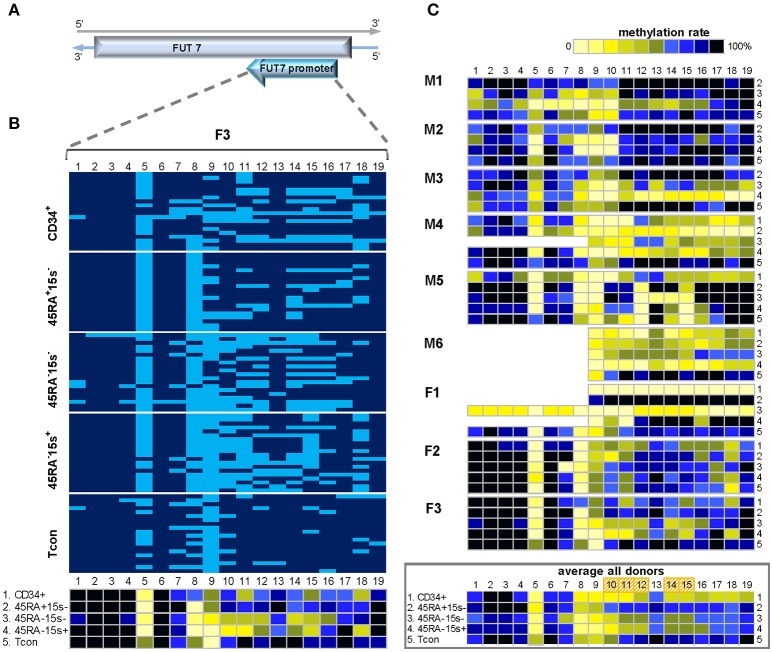
Figure 3.
Methylation pattern of FUT7 promoter. CpG sites 10–12, 14, and 15 within FUT7 promoter display higher demethylation levels in CD34+ and effector Treg as compared to naïve Treg and Tcon, indicating that CpGs 10-15 can be used as an additional molecular marker to distinguish these cell populations. (A) Schematic presentation of FUT7 promoter encoded in the reverse strand of chromosome 9. (B) Methylation pattern of FUT7 promoter in five cell populations: CD34+ (1), CD45RA+CD15s− (2), CD45RA−CD15s− (3), CD45RA−CD15s+ (4), and Tcon (5) of representative donor F3. CpGs 1-19 are numbered relative to the 5′-3′ direction of the coding (reverse) strand. Each horizontal line represents DNA from one cell with unmodified C in light blue and mC in dark blue. Methylation percentage for each CpG site was calculated based on the number of mCs in a total of 20 and summarized in the panel below. (C) Methylation patterns of FUT7 promoter of individual donors with the average methylation pattern for all donors presented in the panel below. See also Supplementary Figures 1, 3.

