
Figure 7.
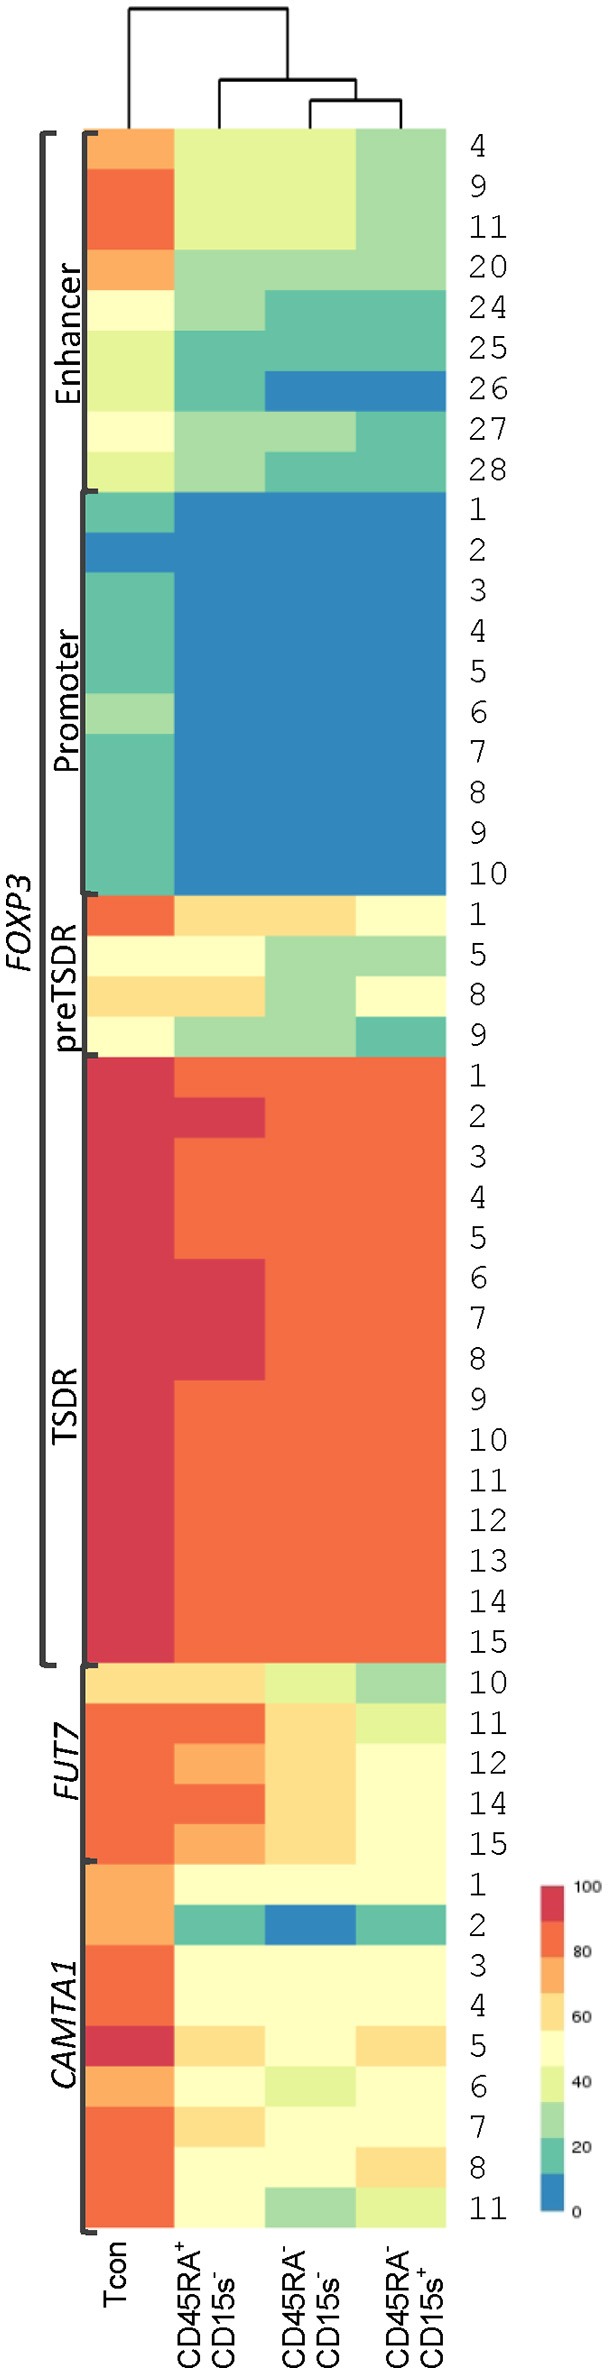
Hierarchical clustering of Tcon and Treg (CD45RA+CD15s−, CD45RA−CD15s−, and CD45RA−CD15s+) subtypes based on average methylation. CpG positions with striking methylation differences across the cell subtypes were further analyzed after an unbiased clustering method examining the distance of cell subtypes from each other based on average CpG methylation for each genomic element (see also Supplementary Figure 1). Each row corresponds to CpG positions for each genomic element.