
Figure 2.
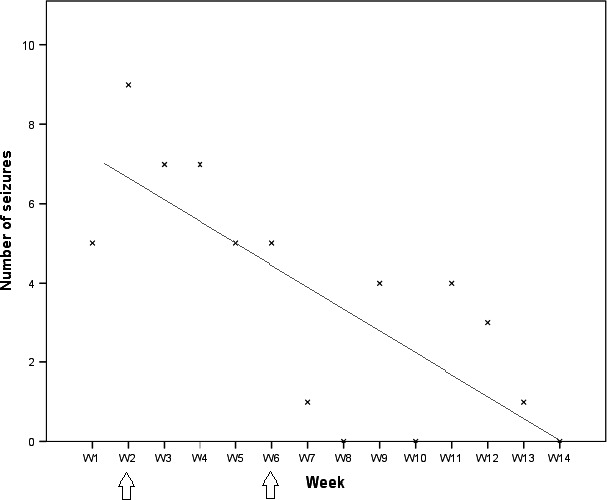
Total number of seizures per week (W). The linear trend curve shows the decrease in the number of seizures. Lithium introduced at week 2 (first arrow) and final therapeutic dose reached at week 6 (second arrow)
Official websites use .gov
A
.gov website belongs to an official
government organization in the United States.
Secure .gov websites use HTTPS
A lock (
) or https:// means you've safely
connected to the .gov website. Share sensitive
information only on official, secure websites.
Total number of seizures per week (W). The linear trend curve shows the decrease in the number of seizures. Lithium introduced at week 2 (first arrow) and final therapeutic dose reached at week 6 (second arrow)