. 2018 Oct 10;6(11):2208–2210. doi: 10.1002/ccr3.1801
© 2018 The Authors. Clinical Case Reports published by John Wiley & Sons Ltd.
This is an open access article under the terms of the http://creativecommons.org/licenses/by/4.0/ License, which permits use, distribution and reproduction in any medium, provided the original work is properly cited.
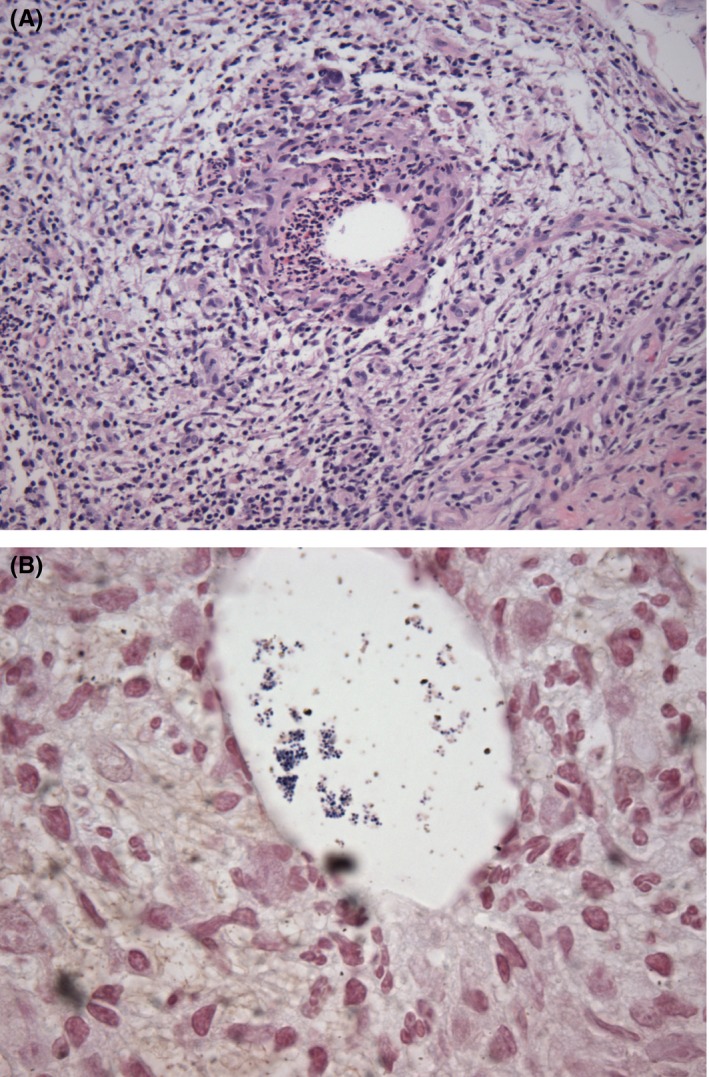
Figure 2.

H&E section at 200× (A); Gram stain at 1000× (B)
