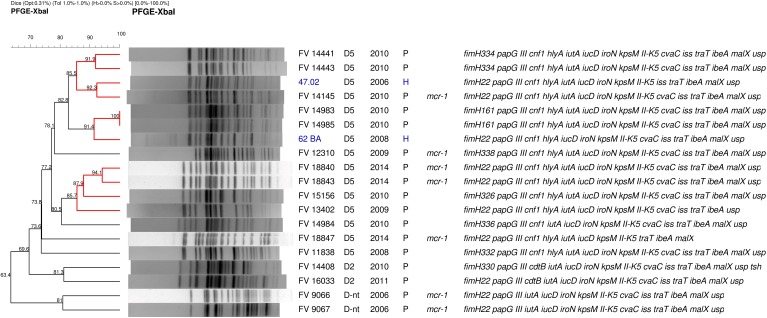
FIGURE 2.
PFGE macrorrestriction profile of 17 pig E. coli isolates belonging to the clonal group O25:H4-B2-ST131 (one ST131 isolate resulted autodigested) compared with two human clinical isolates of the LREC collection (showed in blue): association between isolation code, virotype, year, and origin of isolation (P, pig; H, human), mcr-1 presence, and virulence profile is indicated on the right. Highlighted in red clusters of similarity >85%.

